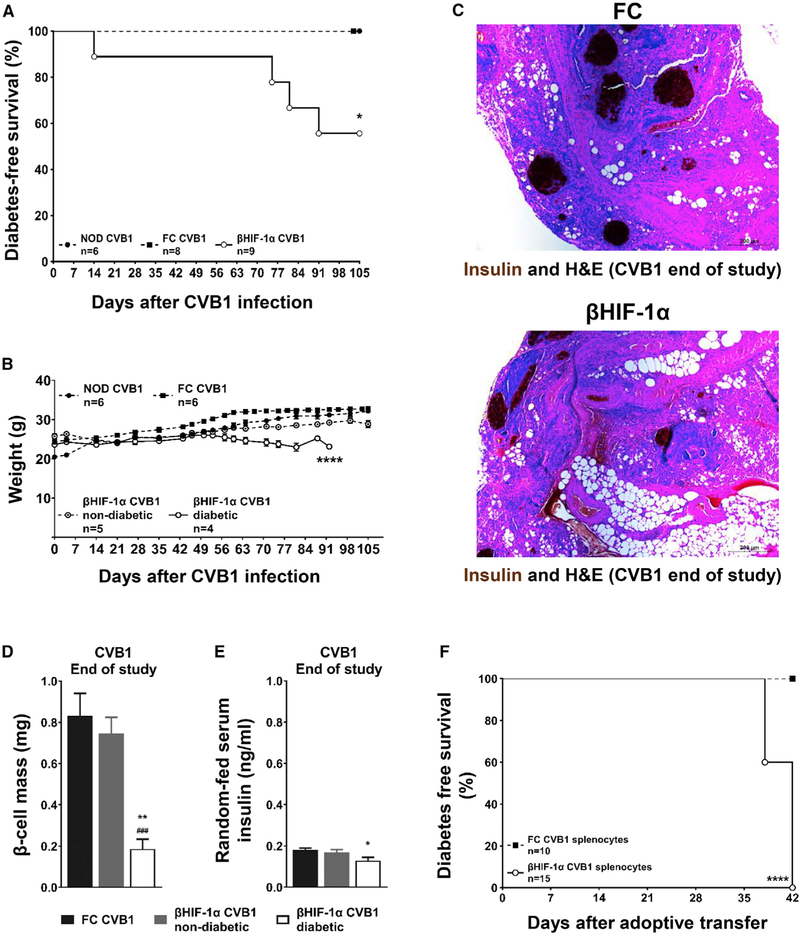
Figure 2. βHIF-1α Mice Develop T1D When Exposed to CVB1.
(A) Kaplan-Meier plot of diabetes-free survival in mice infected with CVB1. *p < 0.05 overall.
(B) Weight of mice post-CVB1 infection. ****p < 0.0001, ANOVA.
(C) Insulin and H&E pancreatic sections at sacrifice after CVB1 infection. Scale bar, 200 μm.
(D) β cell mass in FC (black bars) and in non-diabetic (gray bars) and diabetic (white bars) βHIF-1α mice (n = 8, 5, and 4 per group, respectively) at the end of the study post-CVB1 infection. **p < 0.01 versus FC mice; ###p < 0.001 versus non-diabetic βHIF-1α mice.
(E) Serum insulin in FC (black bars) and in non-diabetic (gray bars) and diabetic (white bars) βHIF-1α mice (n = 8, 5, and 4 per group, respectively) at the end of the study. *p < 0.05 versus FC mice.
(F) Kaplan-Meier plots for diabetes-free survival in NOD-SCID recipients that were given splenocytes from CVB1-infected FC (black squares, dashed line) or βHIF-1α mice (white circles, solid line). n = 10–15 recipients per group. ****p < 0.0001.
Data are means ± SEMs.

