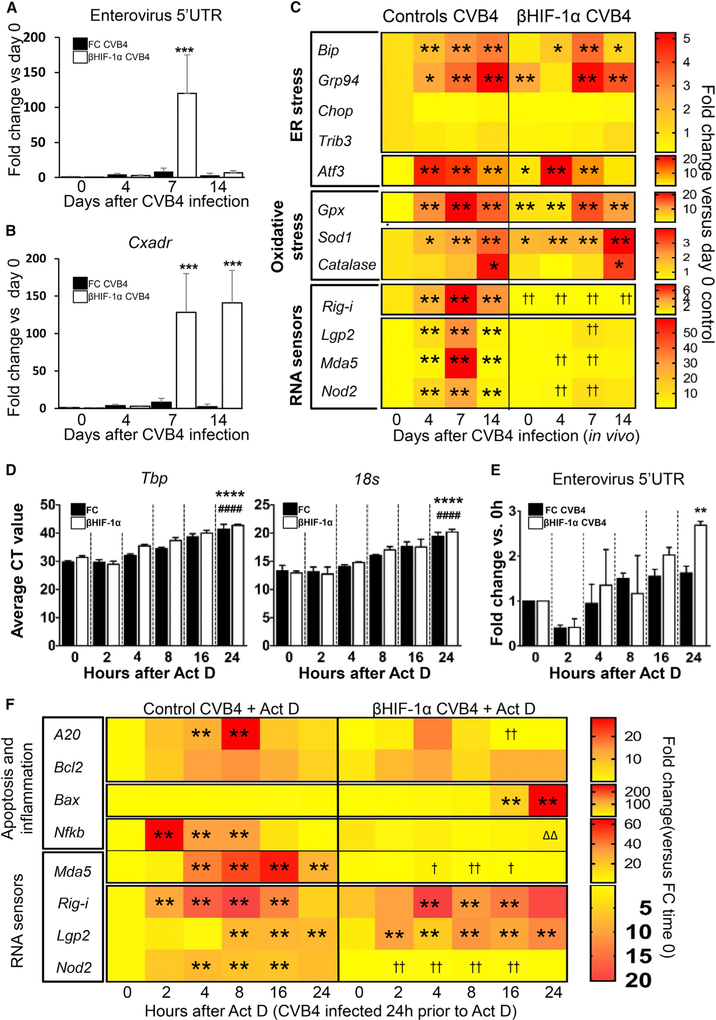
Figure 5. Gene Expression Changes in FC and βHIF-1α Mouse Islets following CVB4 Infection.
(A) Expression of enterovirus (EV) RNA in uninfected and CVB4-infected FC (black bars) and βHIF-1α (white bars) mice at 4,7, and 14 dpi (n = 5 per group per time). Data are medians and 95% confidence intervals. ***p < 0.0001 versus matching time.
(B) Expression of coxsackievirus and adenovirus receptor (Cxadr) in uninfected and CVB4-infected FC (black bars) and βHIF-1α (white bars) mice at 4, 7, and 14 dpi (n = 5 mice per group per time). Data are medians and 95% confidence intervals. ***p < 0.0001 versus matching time.
(C) Heatmap of real-time PCR of ER stress, oxidative stress, and RNA sensor gene expression in islets from uninfected and CVB4-infected mice at 4,7, and 14 dpi (n = 5 per group). **p < 0.01 compared to control uninfected (day 0). †† p < 0.01 for decreased expression versus time-matched controls.
(D) Average CT (cross-threshold) values for TATA-Box binding protein (Tbp) and 18 s housekeeping genes in islets from FC (black bars) and βHIF-1α (white bars) after 24-h CVB4 infection followed by actinomycin D treatment for the times indicated.
(E) Expression of enterovirus RNA in islets from FC (black bars) and βHIF-1α (white bars) mice after 24-h CVB4 infection and actinomycin D treatment.
(F) Heatmap plot of real-time PCR data of inflammatory and/or apoptotic and RNA sensor gene expression changes in islets from FC and βHIF-1α mice collected after 24-h CVB4 infection followed by treatment with actinomycin D for the time shown. **p < 0.01 compared to control 0 h. ††p < 0.01 for decreased expression versus time-matched FC. ΔΔDecreased expression versus βHIF-1α baseline.
Data are means ± SEMs.

