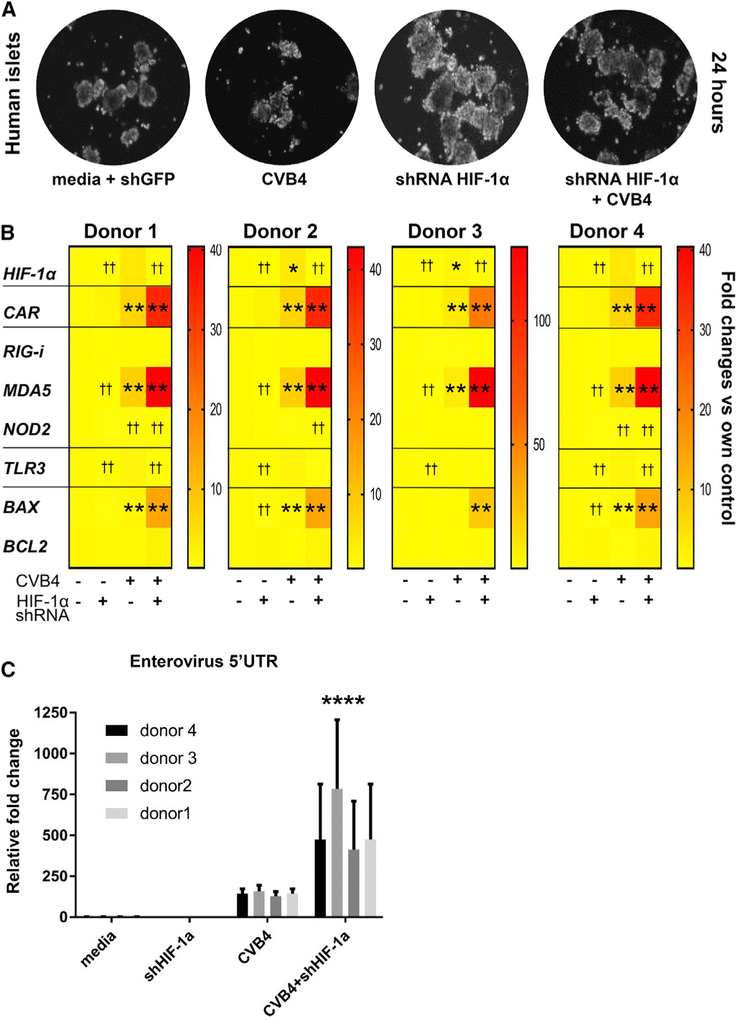
Figure 6. Gene Expression Changes in Human Islets after HIF-1α Knockdown and CVB4 Infection.
(A) Bright-field microscopic images ofisolated human control islets in culture ± HIF-1α knockdown and ± CVB4 infection at 24 h. Magnification x20.
(B) Heatmap of gene expression changes (n = 4 individual human donors, triplicate samples from each donor per time point). *p < 0.05 and **p < 0.01 for increase versus media. ††p < 0.01 for decrease versus media control.
(C) Expression of enterovirus RNA in human control islets from 4 distinct donors, after HIF-1α knockdown and CVB4 infection collected at 24 h (n = 4 individual human donors, triplicate samples from each donor per time point). Enterovirus RNA was not detected in uninfected islets. ****p < 0.0001 versus islets infected with CVB4 alone by 2-way ANOVA with Dunnett’s correction.
Data are means ± SEMs.

