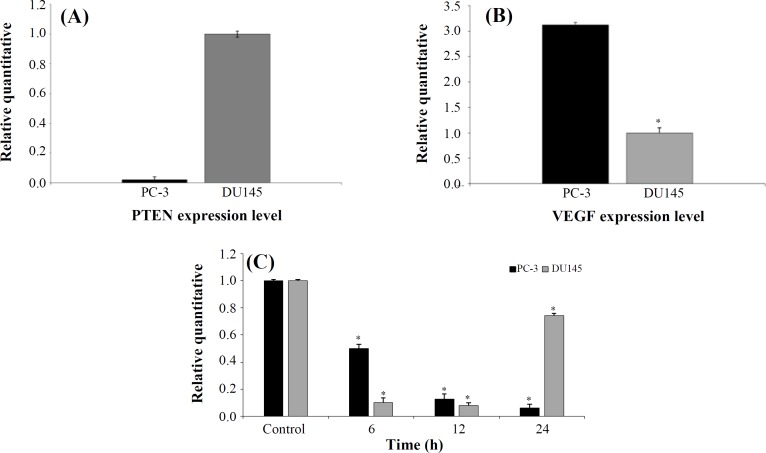
Fig. 6.
Real-time PCR analysis of PTEN and VEGF messenger RNA (mRNA) expression in DU145 and PC-3 cells. Relative (A) PTEN- and (B) -VEGF expression between two the cell lines. (c) Changes in VEGF mRNA levels following AZD2461 treatment (59.03 μM for DU145 and 36.48 μM for PC-3 cells according to IC50 values after 48 h of exposure) in a time-dependent manner (6, 12, and 24 h). Error bars represent SD. *p < 0.05 compared to untreated control

