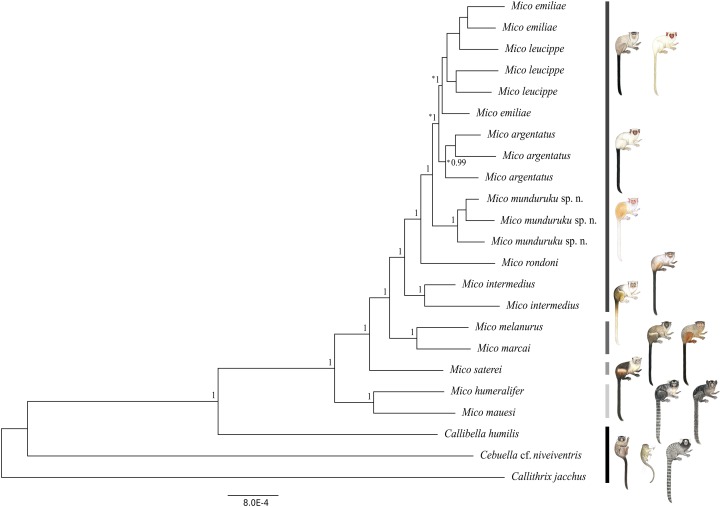
Figure 2. Bayesian phylogeny of the genus Mico.
Gray-scale bars represent the main species lineages in genus Mico, black bar represent the outgroups. Clade posterior probabilities are given above nodes. Asterisk (*) indicates low (<70%) bootstrap support in the Maximum Likelihood phylogeny which otherwise was identical to the Bayesian inference phylogeny. Illustrations: Stephen Nash.

