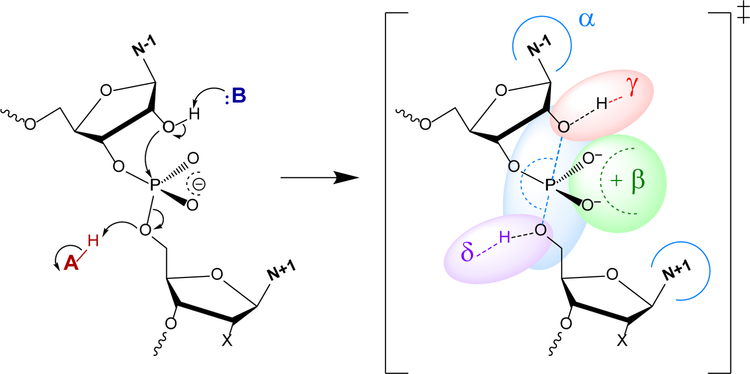
Figure 1.
2′-O-transphosphorylation leading to cleavage of the RNA backbone (left of central arrow) and idealized transition state highlighting the general catalytic strategies16 (right of central arrow).  - Arrangement of the O2′ nucleophile, P (scissile phosphorus), and O5′ leaving group in an in-line attack geometry (facilitated by contacts, indicated by blue arcs, that splay the N−1 and N+1 bases).
  - Stabilization (neutralization/protonation) of the negative charge accumulation on the non-bridging phosphoryl oxygens (NPOs).
  - Activation (deprotonation) of the O2′ nucleophile.
  - Stabilization (neutralization/protonation) of the accumulating negative charge on the O5′ leaving group. Although this schematic uses a transition state model to illustrate the fundamental catalytic strategies, these strategies can impact any state along the reaction coordinate. Colored ovals highlight each strategy and encompass the primary atomic positions (defined in section 4 below) associated with the chemical space of bonds for each strategy.

