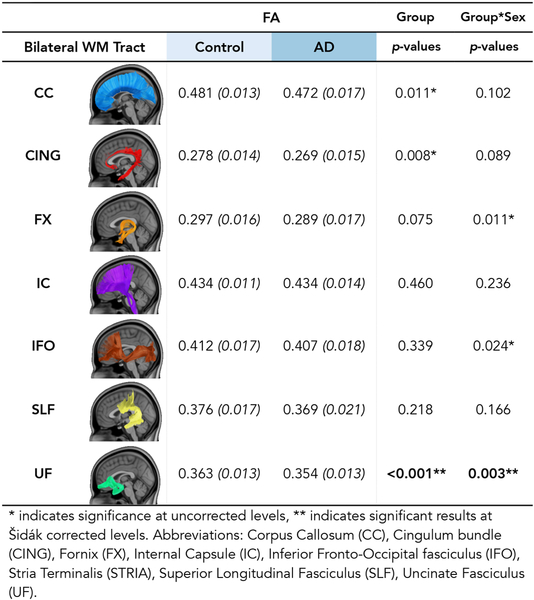
Figure 2.
Group differences in tract fractional anisotropy (FA). Weighted mean FA values by tract for control and anxiety disorder (AD) subjects, with standard deviations in parentheses. Significance of the regression statistics for the main effect of group, as well as the interaction of group by sex are noted. All analyses include age, sex and site as covariates.

