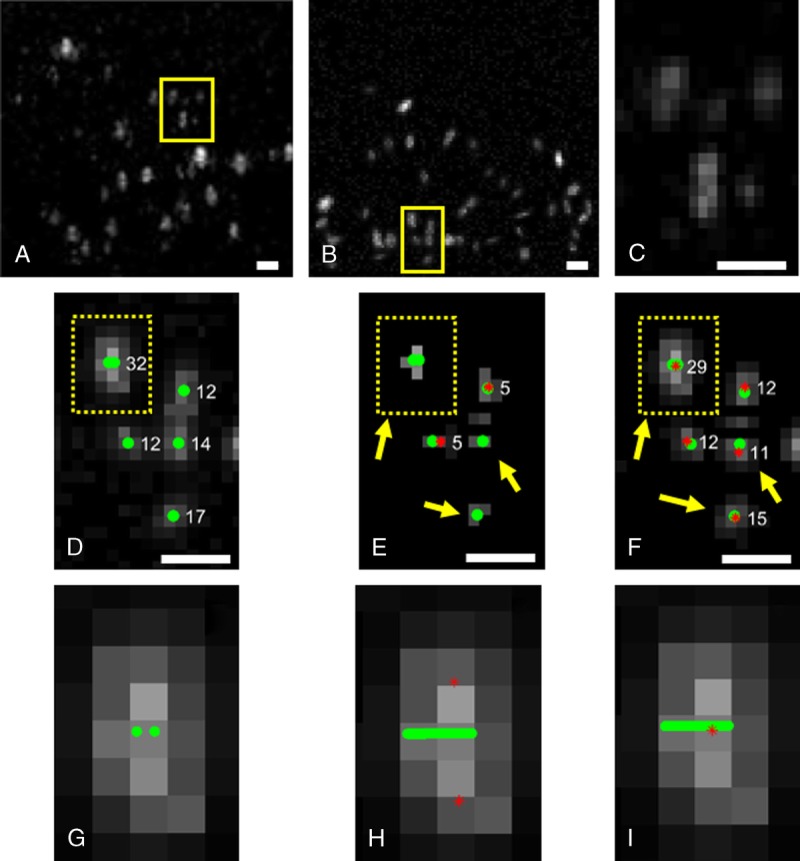
FIGURE 1.

A frame (A) from a sheep ovary video loop and (B) from a synthetic data set constructed in resemblance with the previous in vivo data set. C and D, Images are the magnified yellow image sections from panels A and B, respectively. The final MB segmentation using panel E, the gradient image, and panel F, the inverted Gaussian image, as the input variable of the watershed transform. G, A magnified overlapping MB from panel D consisting of 2 single events. H, Detection of 2 single MBs that are located 172 μm and 224 μm away from the tube (the yellow line). Detection of one overlapping MB event that is located 14 μm away. The original location of the ground truth centers is in green circles, the detected MB centers by the software in red stars and their size in white label. Scale bars, 1 mm.
