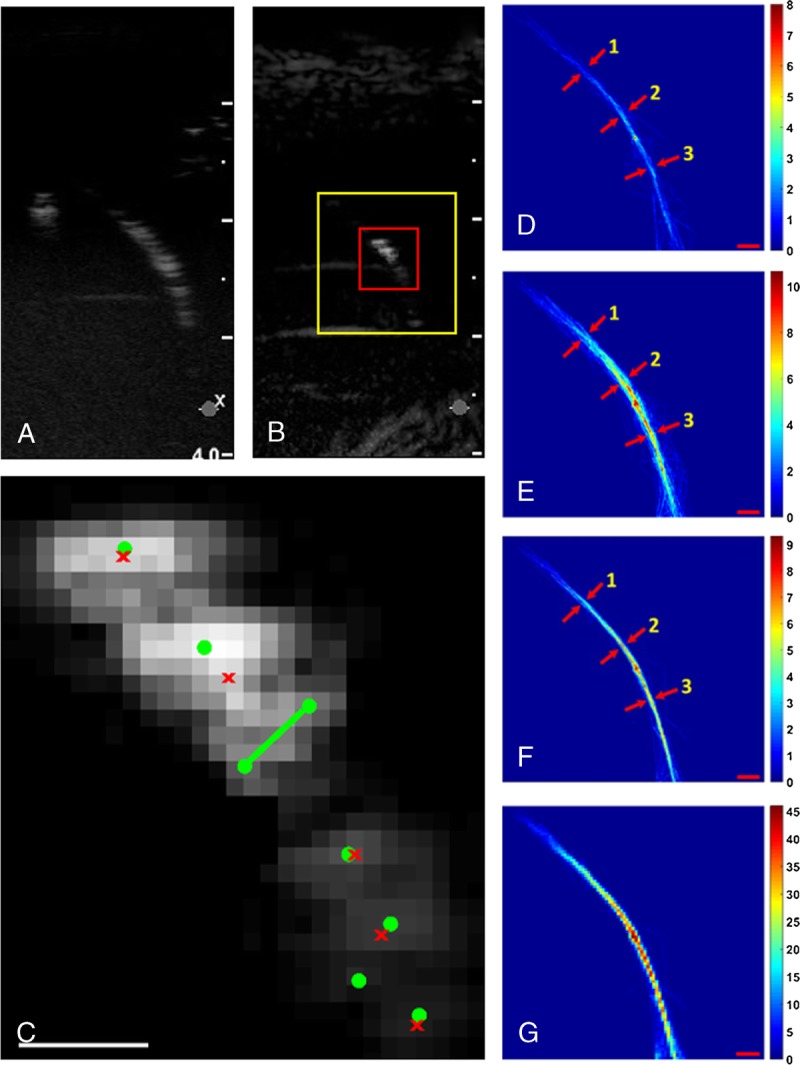
FIGURE 3.

A, A B-Mode frame and (B) the corresponding contrast mode frame from a single tube in an in vitro experiment. C, Localization example within the red box (A) trying to detect single events (green circles) and single and overlapping events (red crosses). Trying to segment the region into single events creates localization 678.48 μm apart (green line), which implies localizations outside the tube (tube width is 200–300 μm). The density map with 3 × 3 subdivision process as the result of the tracking algorithm using the inverted Gaussian image as input of the watershed function detecting (D) only (isolated) single MBs, (E) any (segmented) single MB, and (F) both single and overlapping MBs. G, The density map of (E) in original pixel size. The FWHM was calculated in 3 parts of the tube, 1–3 and as it shown in panels D, E, and F pointed with red arrows and explained in details in Table 2. The scale bar is 1 mm throughout.
