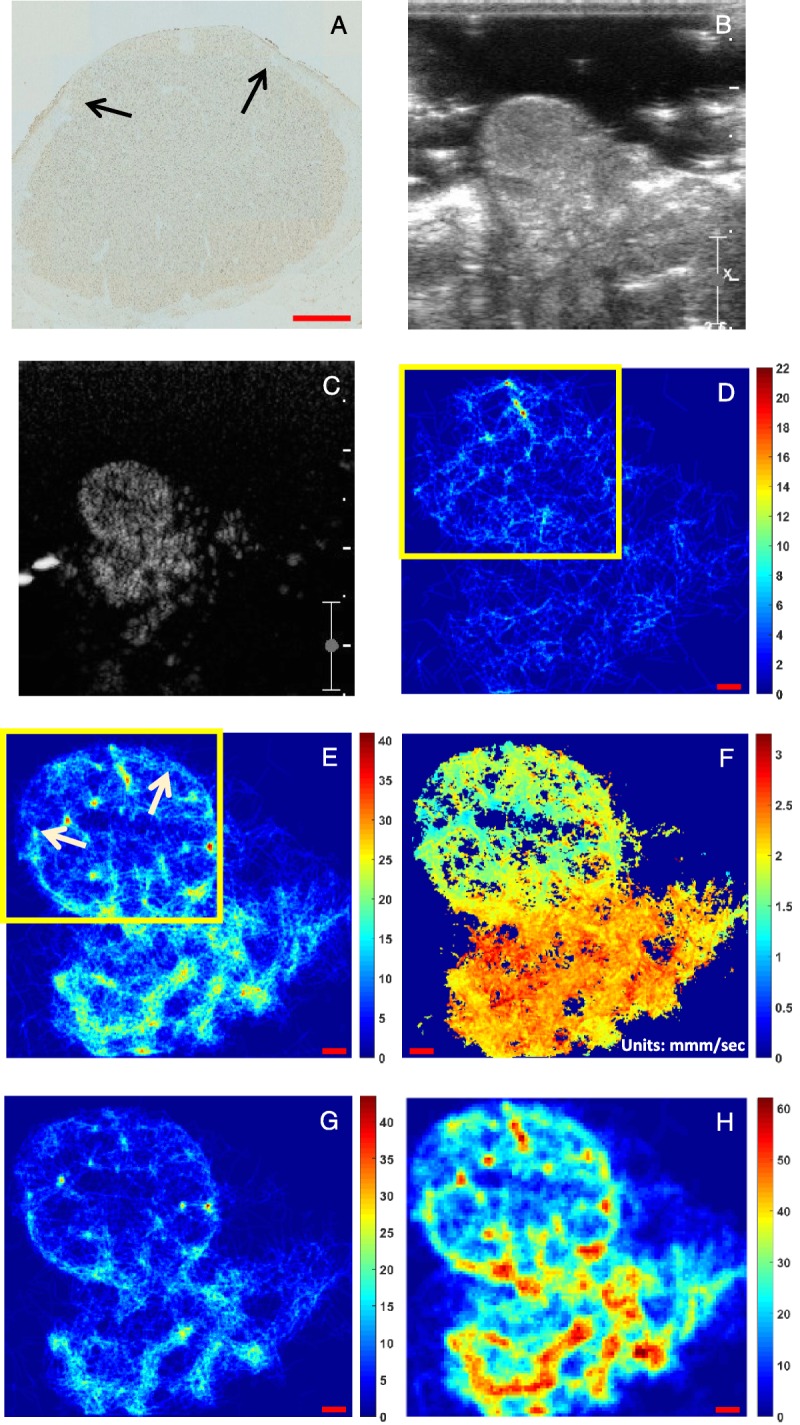
FIGURE 4.

A, Histology (×20 tiled microscopy) of the corpus luteum (CL) of a sheep ovary. B, The B-mode frame and (C) the corresponding peak contrast frame from the CL include the supporting artery and vein branches from the ovarian artery and vein respectively that support the gland and are not available in (A). The density map with 3 × 3 subdivision process as the result of the tracking algorithm using the inverted Gaussian image as input of the watershed function and detecting (D) only single MBs and (E) both single and overlapping MBs while (F) is the corresponding velocity map for (E). Panel G is the equivalent of E using the gradient image instead of the inverted Gaussian. Panel H is the equivalent of E in original pixel size. The color bars indicate the number of the tracks per pixel for the density maps and the average mean velocity (millimeter per second) for the velocity maps. The scale bar is 1 mm throughout.
