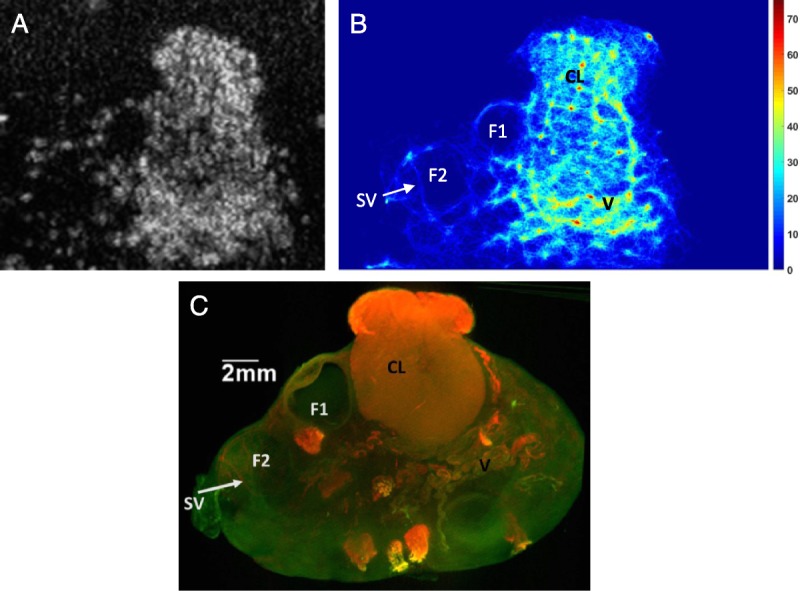
FIGURE 6.

Comparison of a density map (by processing 1246 frames) obtained by imaging the sheep ovary with CEUS and using a 2.4-mL bolus injection of SonoVue, with a subvolume selected from a 3D reconstructed OPT volume (A) peak contrast ultrasound image, (B) density map, and (C) OPT image using maximum intensity projection to display a 2-mm-thick volume. There are structures in the ovary identifiable in both the density map and the OPT slice such as the follicles (F1 [OPT: area 5.6 mm2 wall thickness 173 μm; density map: area 6.4 mm2 wall thickness 344 μm], F2 [OPT: 11.3 mm2 wall thickness 258 μm; density map: area 14.7 mm2 wall thickness 340 μm]), the CL (OPT: area 45.3 mm2; density map: area 88 mm2), and larger vessels (V). The dip in the follicle 1 wall in the OPT image is due to the delicate surface of the follicle on the edge of the ovary collapsing during the processing. Arrowed is a small vessel (SV) located on the surface of the follicle that can be identified in the OPT image (83 ± 7 μm) and the density map (diameter 141 ± 54 μm).
