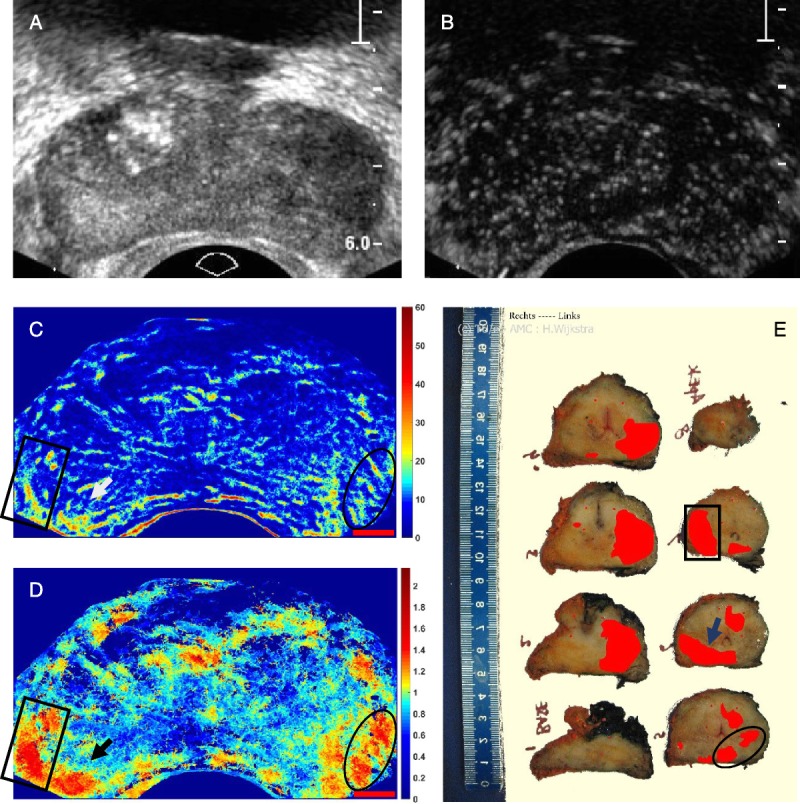
FIGURE 7.

A, B-Mode and (B) contrast mode of a human prostate with a sparse MB population apparent in the late wash-out phase. C, Ultrasound path density map (color map shows number of MB paths). D, Ultrasound velocity map in millimeter per second. Red scale bars in C and D are 5 mm. E, Histology slices of the prostate displaying cancer in red.
