Figure 2.

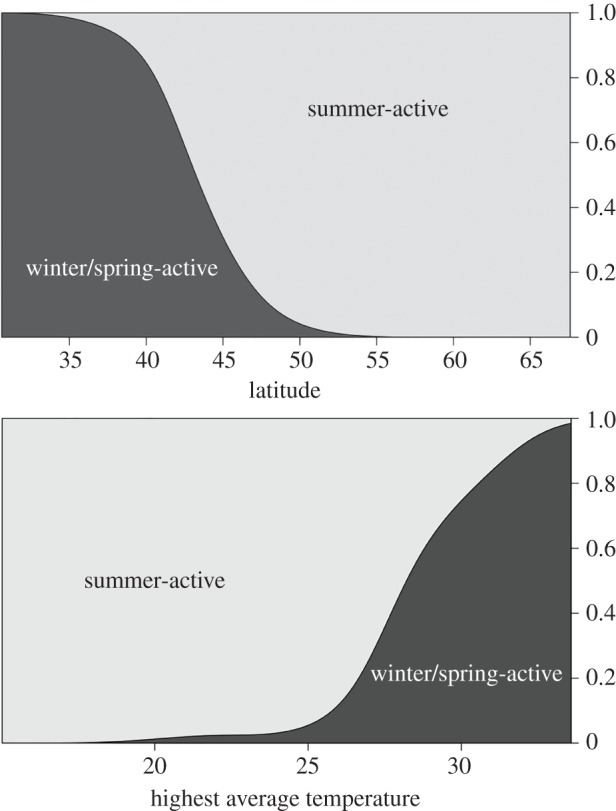
Density plots for winter-active and summer-active populations plotted against latitude and against the average temperature of the warmest month.

Density plots for winter-active and summer-active populations plotted against latitude and against the average temperature of the warmest month.