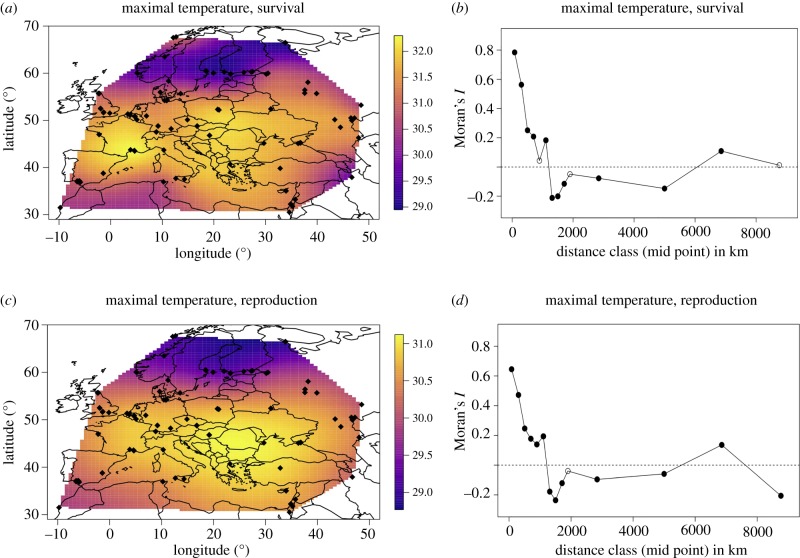
Figure 4.
(a,c) Heat map of maximal temperature for survival (a) and reproduction (c) across the Western Palaearctic (−10° to 60° E). Small black dots mark sampling locations of D. magna genotypes. (b,d) Moran spatial autocorrelation (I) of maximal temperature for survival (b) and reproduction (d). Distance classes become larger with increasing distance. Filled symbols mark significant correlation coefficients (p < 0.05). (Online version in colour.)

