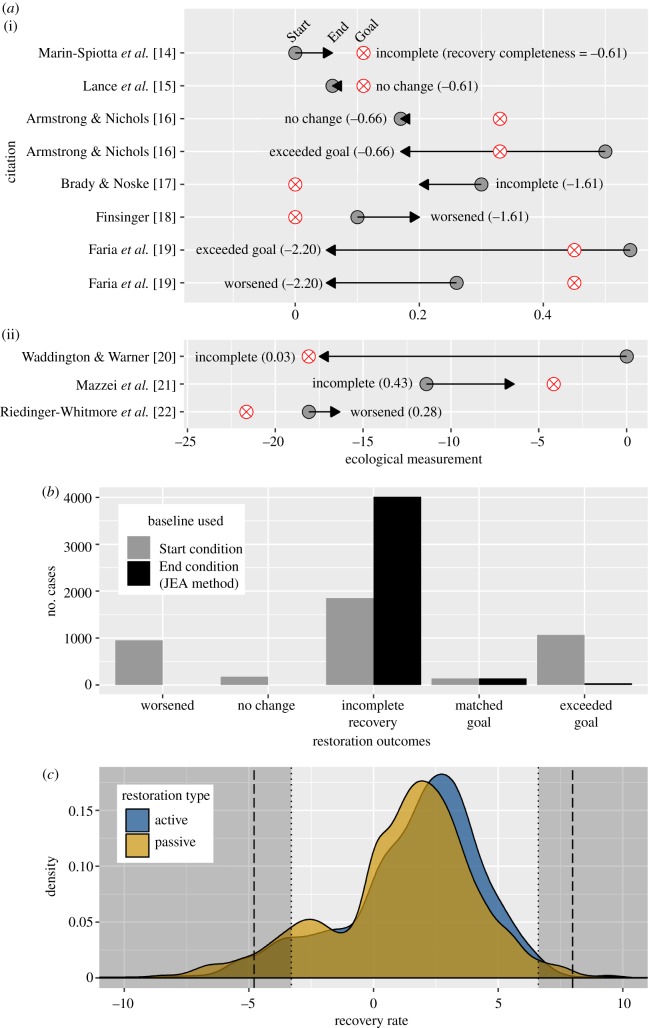
Figure 1.
(a) Recovery completeness's inability to distinguish different restoration outcomes is illustrated with paired examples from JEA's data with equal Ends and Goals but different Starts (i) and positive values arising as artefacts of negative End and Goal values (ii). (b) Counts of restoration outcomes interpreted using Start (appropriate baseline) versus End. (c) Density plot showing distribution of recovery rates. Grey-shaded areas outside dotted lines were excluded from JEA's analysis due to errant outlier removal; dashed lines indicate intended thresholds. (Online version in colour.)

