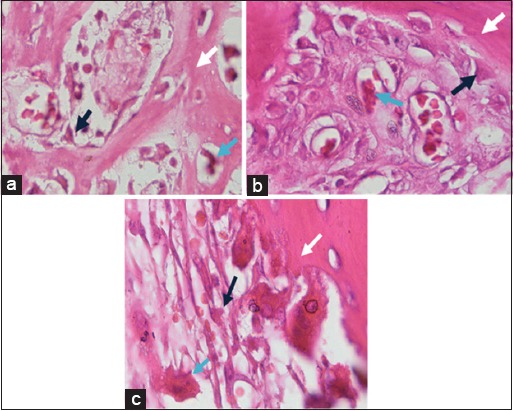
Figure-4.

Observation results of osteoblasts and osteoclasts on day-56 with (a) control treatment group, (b) bovine bone treatment group, and (c) cuttlefish bone treatment group. Black arrows show osteoblasts cells, white arrows show matrix formation, and blue arrows show osteoclasts cells (HE staining, 1000×).
