Figure 3.

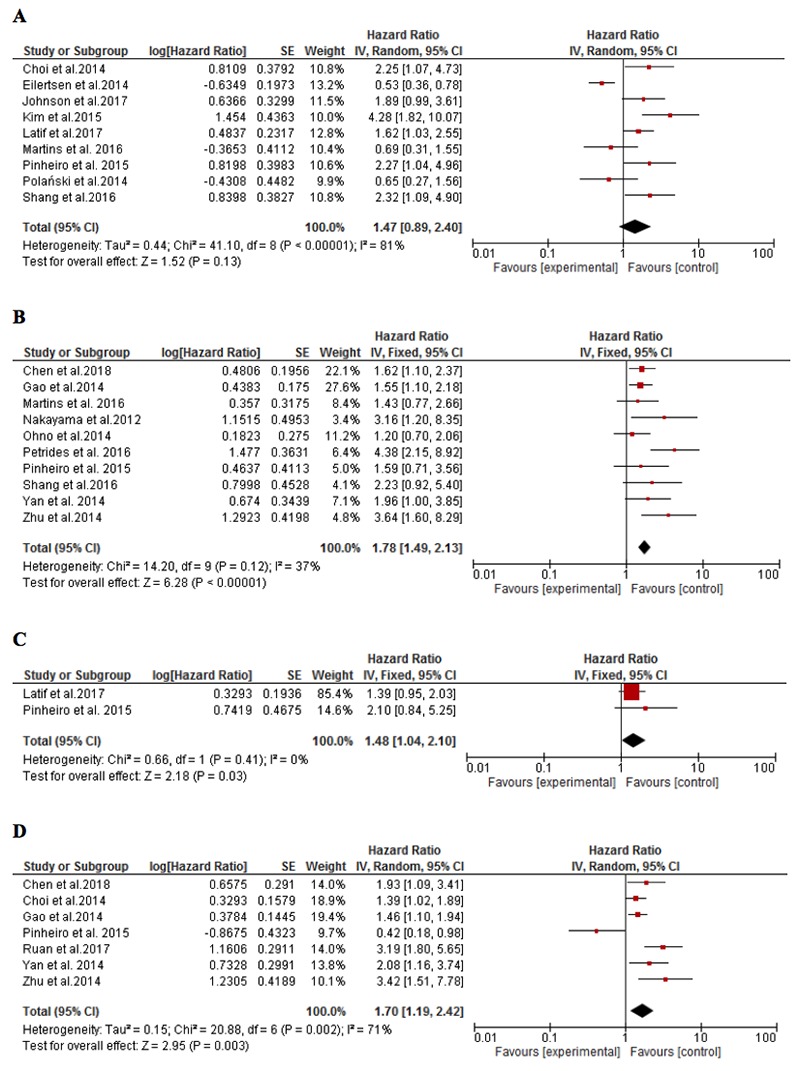
Forest plot depicting the relationship between the overall survival and the expression of MCT1 (A) and MCT4 (B) as well as the relationship between disease-free survival and the expression of MCT1 (A) and MCT4 (B).

Forest plot depicting the relationship between the overall survival and the expression of MCT1 (A) and MCT4 (B) as well as the relationship between disease-free survival and the expression of MCT1 (A) and MCT4 (B).