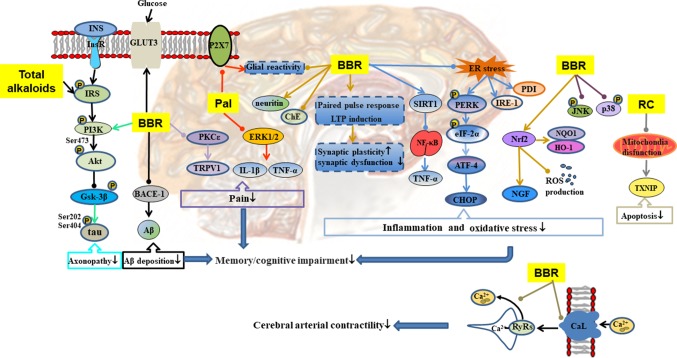
Figure 5.
Mechanisms of RC on diabetic encephalopathy. —• with different colors indicate inhibition/reduction while → with different colors indicate increase/promotion. Arrows of different colors depict different references, and when the results of mechanism research overlap, just randomly select one of the colors. BBR and Pal represent berberine and palmatine.

