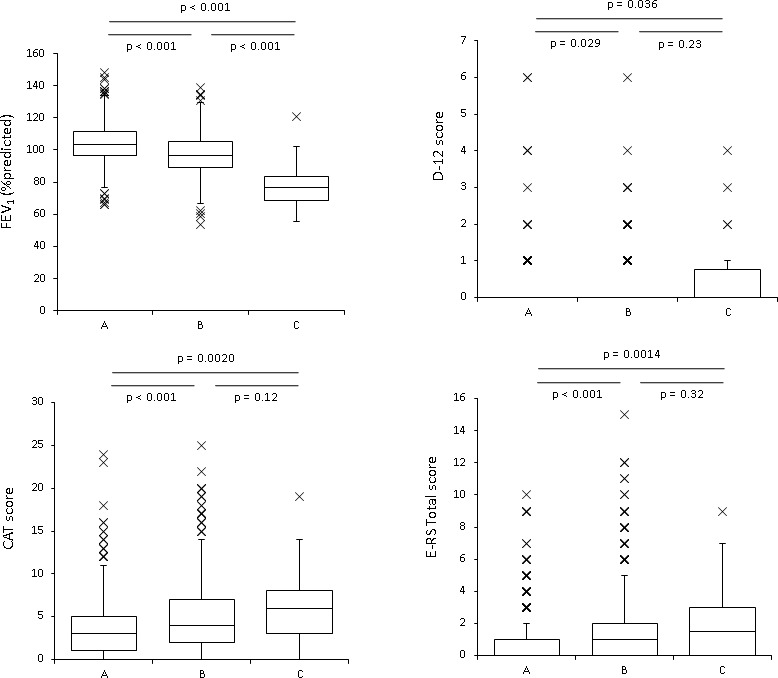
Figure 2.

Box plots representing the distributions of FEV1 (%predicted), D-12 (Dyspnoea-12) score, CAT (COPD assessment test) score and E-RS (Evaluating Respiratory Symptoms in COPD) Total score in non-COPD never smokers (Group A, n=665), non-COPD current or past smokers (Group B, n=867) and COPD based on FEV1/FVC using the LLN (Group C, n=34). The horizontal lines in the boxes represent the median, and the top and bottom of the boxes represent the 75th and 25th percentiles, respectively. Bars represent the upper adjacent value (75th percentile plus 1.5 times the IQR) and the lower adjacent value (25th percentile minus 1.5 times the IQR), and the crosses represent outliers. COPD, chronic obstructive pulmonary disease; FEV1, forced expiratory volume in 1s; FVC, forced vital capacity.
