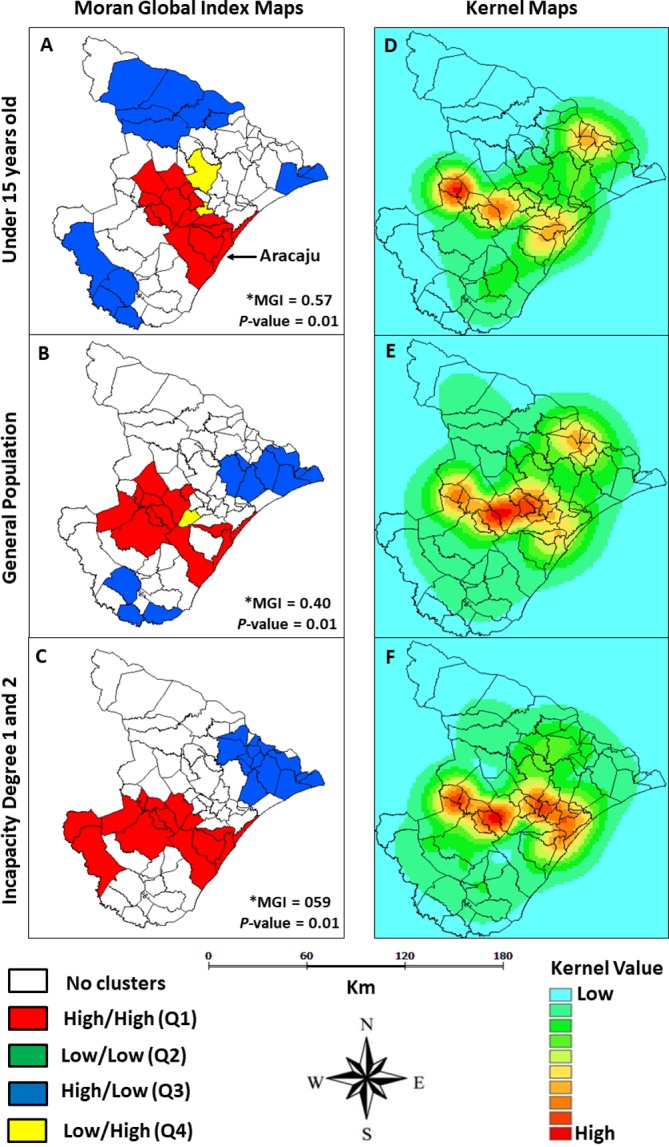
Figure 3.

Spatial analysis maps. Moran Global Index (MGI) maps and Kernel maps were constructed by TerraView Software V.4.2.2. The *MGI was calculated to identify the occurrence of clusters. Moran (A) and Kernel (B) maps of leprosy cases in patients under 15 years old. Moran (C) and Kernel (D) maps of leprosy cases in the general population. Moran (E) and Kernel (F) maps of occurrence of incapacity degrees 1 and 2. Sergipe state, Northeast Brazil (2002—2015).
