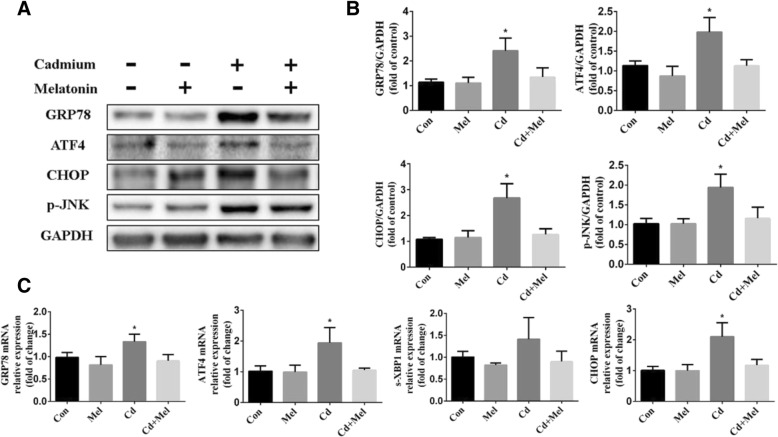
Fig. 2.
Expression of ER stress-related genes and proteins. a Representative western blots of GRP78, ATF4, CHOP and p-JNK expression in 4 groups. GAPDH was used as internal control. b Densitometry of western blots was quantified by the ratios to GAPDH. c Real-time PCR of ovarian ER stress marker genes (GRP78, ATF4, s-XBP1 and CHOP). Data are presented as means ± SD of at least 3 independent experiments. *P < 0.05, compared with the control group

