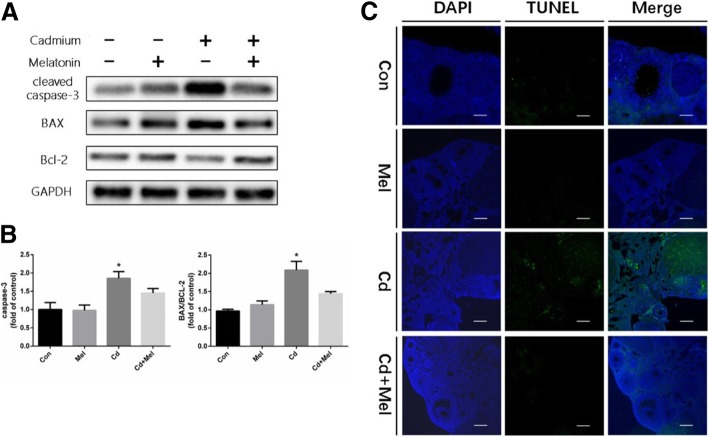
Fig. 3.
The apoptotic levels in ovaries of each group. a Representative western blots of cleaved-caspase 3, BAX and Bcl-2 expression in 4 groups. GAPDH was used as internal control. b Activity of cleaved-caspase 3 and the ratio of BAX/Bcl-2. Data are presented as means ± SD of at least 3 independent experiments. *P < 0.05, compared with the control group. c TUNEL staining was performed on ovarian sections from the four groups. The green fluorescence represents the TUNEL positive signals. The scale bars represent 250 μm

