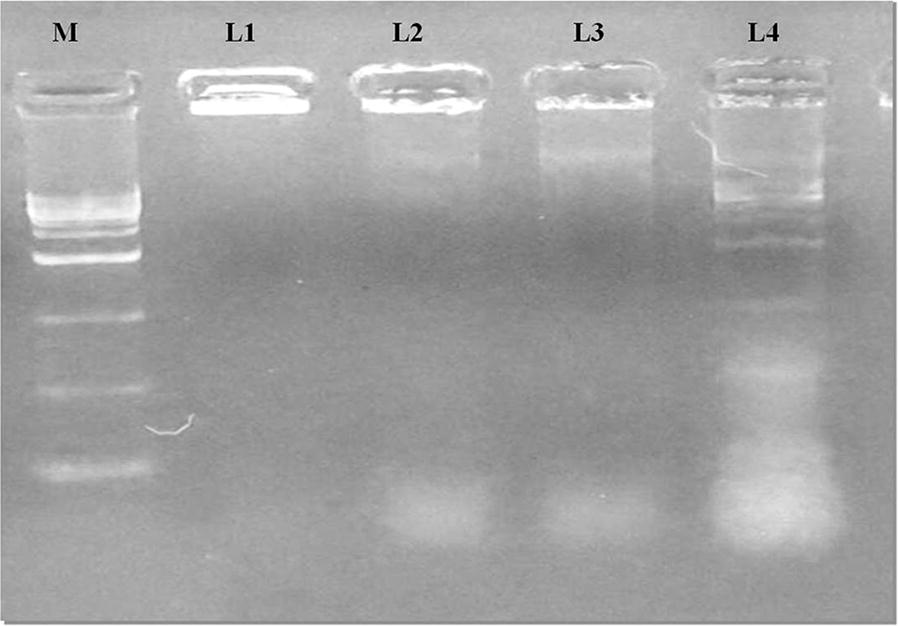
Fig. 4.

Analysis of DNA fragmentation induced by PAC in HT-29 cells for 24 h. Control cell lines incubated with DMEM medium alone. DNA fragmentation was assessed by 1.5% agarose gel electrophoresis and ethidium bromide staining and viewed under a UV transilluminator. Fragmented internucleosomal DNA appears as a ladder. “M” represent 1 bp DNA marker, (L1) Untreated, (L2) 3.12 µM, (L3) 6.25 µM and (L4) 12.5 µM
