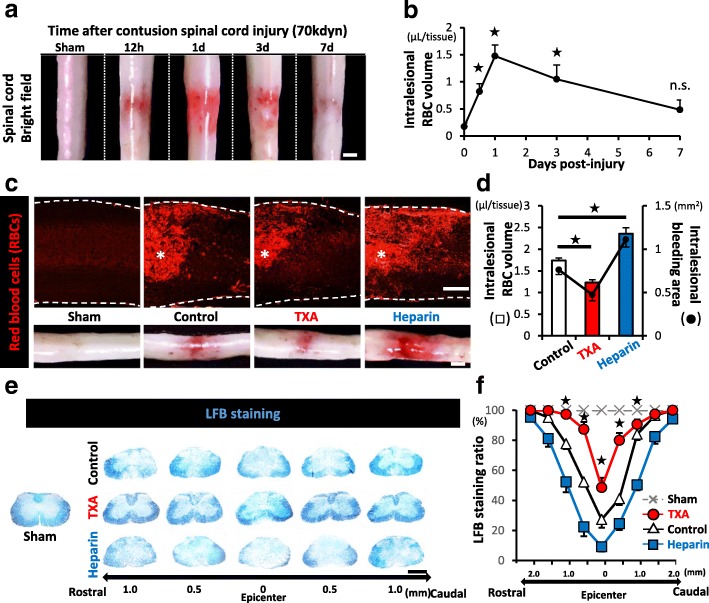
Fig. 1.
The intralesional bleeding volume is associated with the severity of demyelination after SCI. a The temporal macroscopic appearance of intralesional bleeding after SCI. b The time-course of the intralesional RBC volume after SCI (n = 4 at each time point). c IHC staining of sagittal sections of the injured spinal cord of sham-, saline-, TXA-, or heparin-treated mice at 1 dpi. * indicates the lesion epicenter. Intralesional RBCs are stained with TER119 (red). The insets at the bottom show representative bright field images of the each injured spinal cord. d The intralesional RBC volume (left Y axis: bar graph) and the intralesional hemorrhage area (right Y axis: dot graph) of the each injured spinal cord at 1 dpi (n = 8 in each group). e LFB staining of axial sections of each injured spinal cord from 1 mm rostral to 1 mm caudal to the lesion epicenter at 7 dpi. f LFB-positive spared myelin of (e) was quantified based on the LFB staining ratio (n = 6 in each group). Scale bars, 1 mm (a, e) and 500 μm (c).*p < 0.05, Dunnett’s test in comparison to sham mice (0 dpi) (b) and to saline-treated control mice (d), and one-way analysis of variance (ANOVA) with a Tukey-Kramer post-hoc test (f); n.s., not significant. Error bars indicate the SEM

