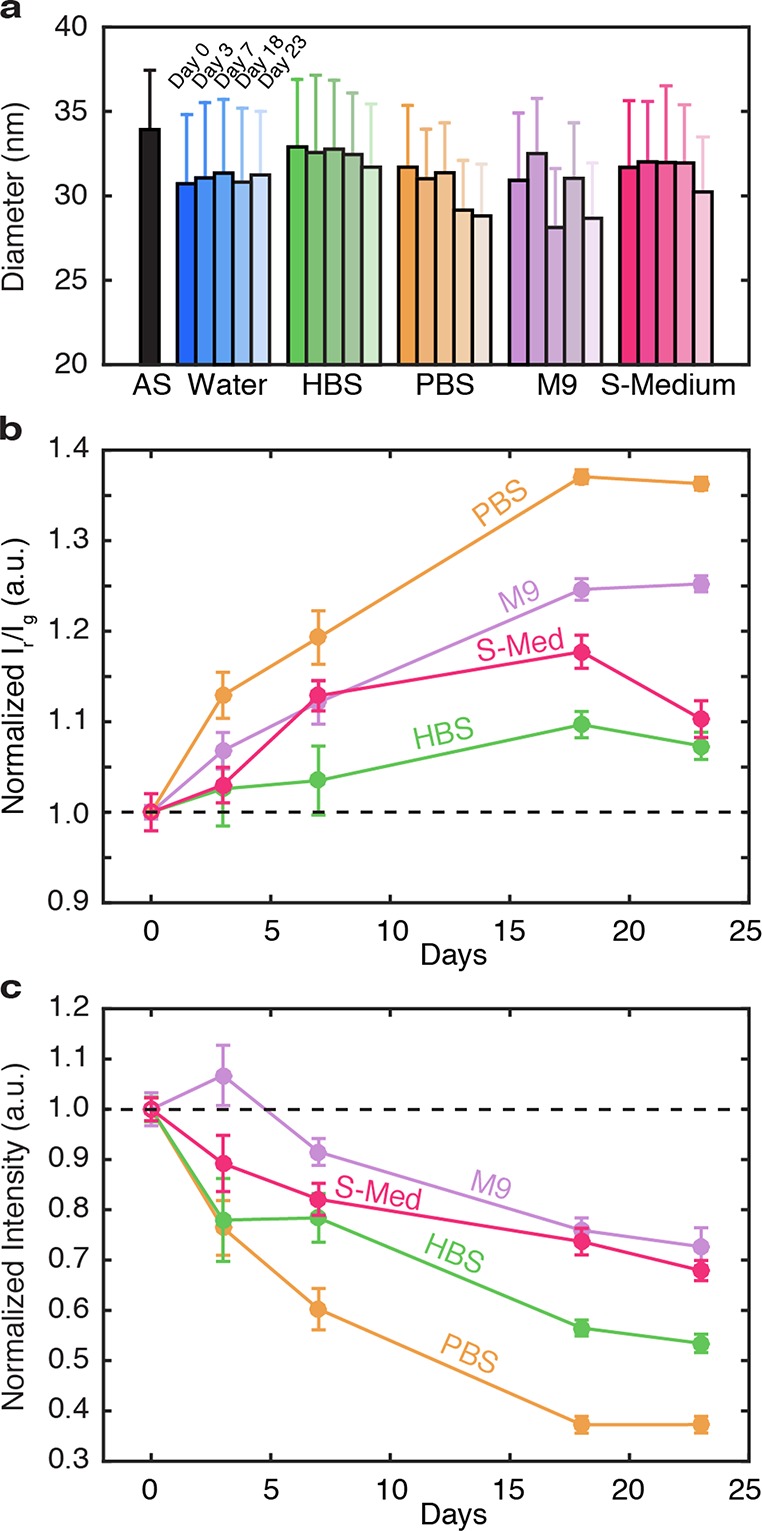
Figure 3.

Structural and optical properties in buffers over time. Changes in (a) average nanoparticle diameter, (b) red-to-green emission ratio, and (c) emission intensity are recorded over 3 weeks after nanoparticles are suspended in a variety of aqueous media: water (blue), HBS (green), PBS (orange), M9 (purple), and S-Medium (pink). In part (a), the black bar represents the diameter of as synthesized (AS) nanoparticles prior to ligand-stripping. Error bars represent the standard deviation or size distribution of 100–200 nanoparticles analyzed from TEMs (see the SI). Note that values for (b) ratio and (c) intensity are normalized to Day 0 values for each buffer, while dashed lines indicate ideal photostability or constant emission over time. Nanoparticle concentration (10 mg/mL) and illumination conditions (100 W/cm2) are kept constant throughout the duration of the experiment. Here, error bars represent the standard deviation of three spectra collected at each time point.
