
Figure 4.
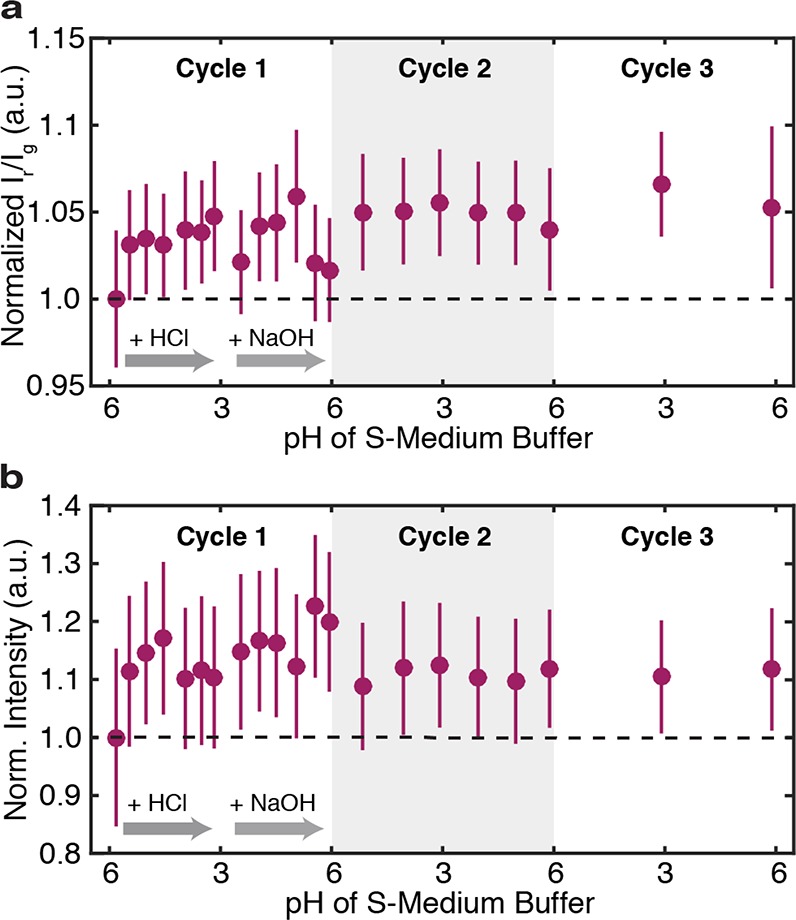
pH dependence of upconversion in S-Medium. Changes in normalized (a) red-to-green ratio and (b) intensity from initial values (dashed lines) due to pH. For each cycle, hydrochloric acid (HCl) is added to lower the pH of S-Medium down to pH 3, and then, sodium hydroxide (NaOH) is added to increase the pH back to pH 6. Error bars represent the standard deviation of values analyzed from 9 spectra collected at each point. In part b, intensity values are corrected for the dilution of particle concentration as a result of adding acidic and basic solutions (see the Methods section). See Figure S9 for additional cycles and uncorrected intensity data.