Figure 5.
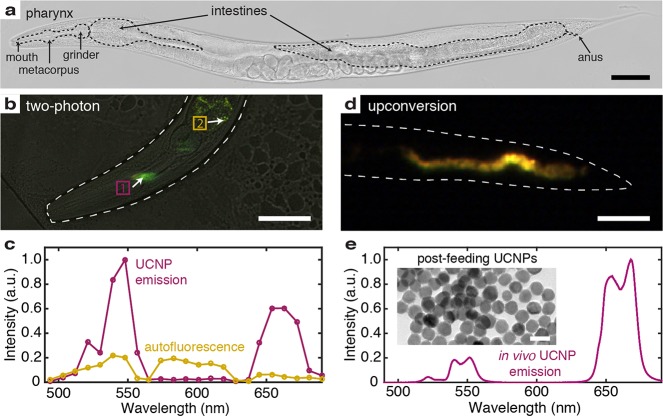
In vivo imaging of upconversion in C. elegans. (a) Bright-field (BF) optical image of a C. elegans worm with parts of the digestive system highlighted. Food passes through the pharynx, then the intestines, and is finally expelled through the anus. (b) A composite 2-photon λ scan for wavelengths between 490 and 690 nm is overlaid on a BF confocal image of a worm’s pharynx. An arrow labeled 1 (maroon) marks emission from the metacorpus region, while an arrow labeled 2 (gold) marks emission from a region past the grinder. (c) Spectra from the two marked areas above. Nanoparticle emission is distinct from tissue autofluorescence and shows the characteristic green and red emission peaks of Er3+. (d) Digital images of a worm in a microfluidic channel are collected under illumination from a 980 nm diode laser. Upconversion emission is detected along the worm’s lower intestines without background fluorescence. Here, the yellow–orange is true to the color of upconversion emission and correlates to the ratio of red and green peaks. (e) Upconversion spectrum of nanoparticles, integrated along the worm’s posterior intestines. The inset is a TEM of nanoparticles collected from the liquid S-Medium culture after overnight incubation. All scale bars for worms are 50 μm, while the scale bar for the TEM is 50 nm.

