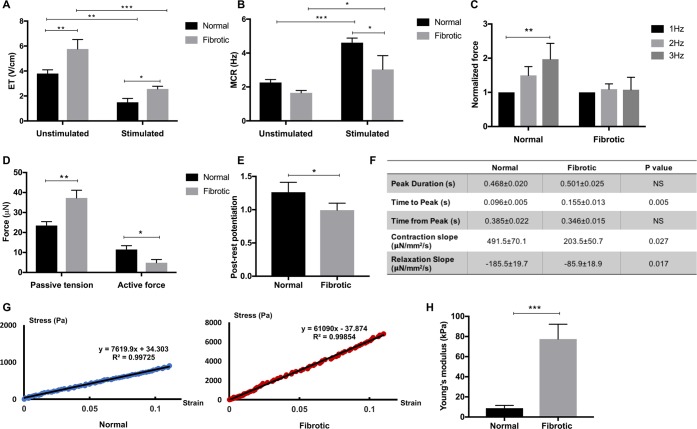
Figure 3.
Fibrotic tissues exhibit inferior contractile properties compared to the controls. (A, B) Excitation threshold (ET) and maximum capture rate (MCR) measurements for the normal and fibrotic tissues cultivated with (stimulated) or without (unstimulated) electrical conditioning (mean ± SD, n ≥ 3, two-way ANOVA). (C) Active force of normal and fibrotic tissues when stimulated from 1 to 3 Hz (mean ± SD, n ≥ 3, one-way ANOVA within each group). (D) Passive tension and active force for the normal and fibrotic tissues at the electrical conditioning end point (mean ± SD, n = 3, Student’s t test within each group). (E) Postrest potentiation (PRP) of force (normalized to the last pacing frequency) in both groups at the end point of electrical conditioning (mean ± SD, n ≥ 3, Student’s t test). (F) Quantification of force dynamics (mean ± SD, n ≥ 3, Student’s t test). (G) Representative stress–strain relationship for the Young’s modulus in each group. The experimental data are from the linear regions of stress–strain curves obtained by the MicroSquisher stretching test. (H) Young’s moduli of normal and fibrotic tissues at the end of electrical conditioning (mean ± SD, n ≥ 3, Student’s t test).

