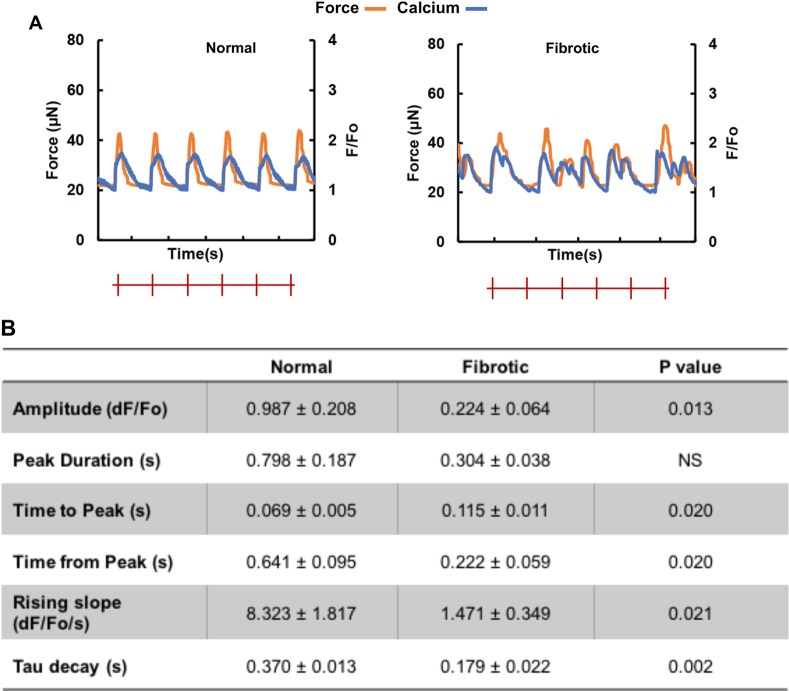
Figure 4.
Fibrotic tissues exhibit abnormal calcium transients and electrophysiological properties compared to the controls. (A) Representative active force (orange) and calcium transient (blue) traces of normal and fibrotic electrically conditioned tissues under electrical field stimulation at 1 Hz. The red marks indicate pacing frequency. (B) Quantification of the calcium transient properties (mean ± SD, n ≥ 3, Student’s t test).

