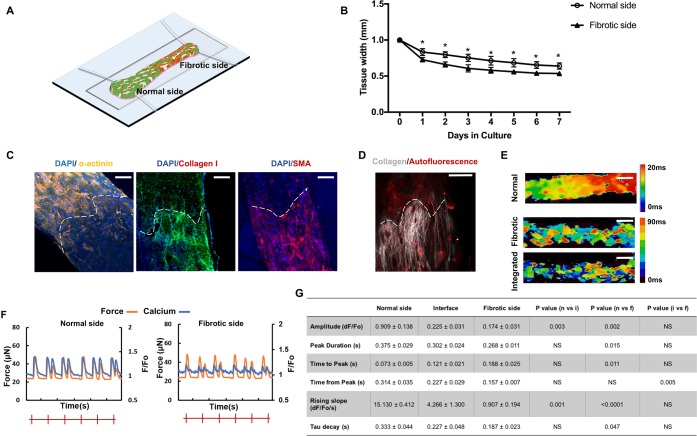
Figure 5.
Construction and characterization of the scar-myocardium integrated model. (A) Schematics of the integrated scar-myocardium model. A model of focal fibrosis is generated by seeding a normal (25%) and a high (75%) percentage of FBs together with CMs at the opposing ends of the Biowire II tissue. (B) Quantification of compaction based on the tissue width measurement on the two opposing sides of the integrated tissue during the first 7 days of culture (mean ± SD, n ≥ 3, one-way repeated measures ANOVA within each group). (C) Representative immunostaining images of the integrated tissue stained for sarcomeric α-actinin, collagen type I, and α-SMA. The dashed lines mark the geometrical segregation at the interface (scale bar = 100 μm). (D) SHG imaging of collagen. The dashed lines mark the geometrical segregation at the interface (scale bar = 100 μm). (E) Conduction velocity maps for normal, fibrotic, and integrated tissues (scale bar = 500 μm). The color scale represents the time for an electrical pulse to pass through in milliseconds. (F) Representative active force (orange) and calcium transient (blue) traces of normal and fibrotic sides on the same integrated tissue under electrical field stimulation at 1 Hz. (G) Corresponding quantification of calcium transients on the opposing sides of the tissues and the interface (mean ± SD, n ≥ 3, one-way ANOVA).

