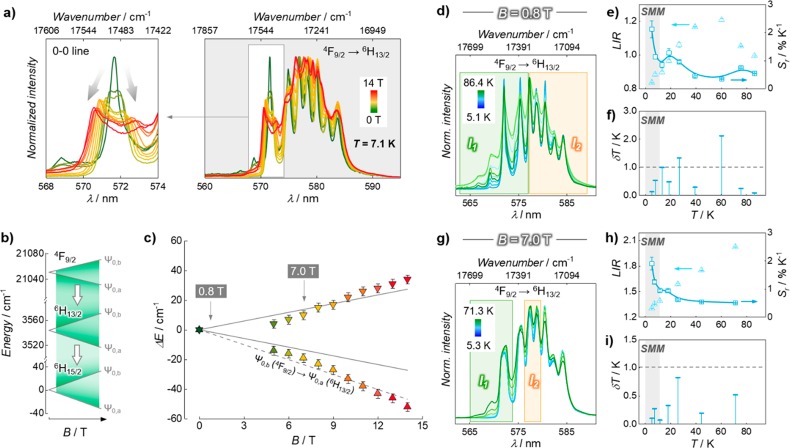
Figure 4.
Effect of magnetic fields on the luminescence of 1 and its performance as a luminescent thermometer. (a) Variation of the emission profile of the 4F9/2 → 6H13/2 DyIII transition under different applied fields. (b) Calculated Zeeman splitting of the lowest mj levels of 4F9/2, 6H13/2, and 6H15/2 DyIII electronic levels. (c) Zeeman splitting of the lowest 6H13/2mj level as obtained from spectroscopy (points) and as estimated from eq 4 (solid lines). The dashed line shows the expected trend considering the Zeeman splitting of the emitting level (4F9/2). Points in part c are color-coded according to the spectra in part a. Luminescence thermometry under applied magnetic fields of (d–f) 0.8 T and (g–i) 7.0 T. (d, g) Emission spectra with the shaded areas indicating the range used for the integration procedure to obtain I1 and I2; (e, h) LIR and corresponding Sr values (light and dark cyan points, respectively). (f, i) Uncertainties. Dashed lines in parts f and i mark the δT = 1.0 K threshold.

