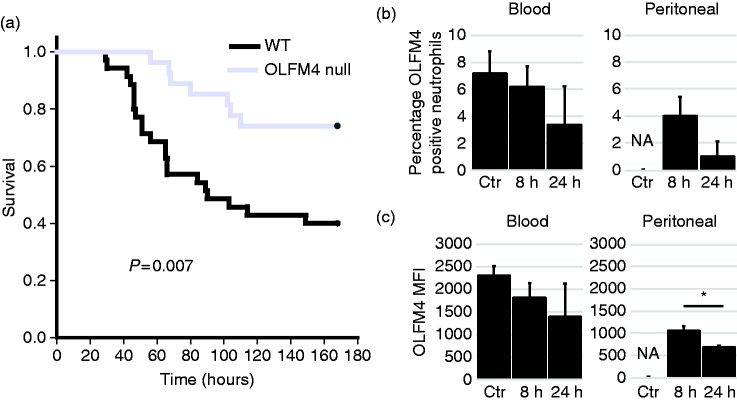
Figure 6.
OLFM4 null mice are protected from septic shock. (a) Kaplan-Meier Survival curve showing OLFM4 null mice (n = 25) have less mortality following cecal ligation and puncture when compared to wild type mice (n = 29). (b) Percentage of OLFM4+ neutrophils from the blood and peritoneum from control and animals that were injected with cecal slurry 8 and 24 h previously. There is a trend toward decrease expression. Percentage of neutrophils could not be determined in control peritoneal samples because there were two few neutrophils to accurately measure. (c) Graphs showing OLFM4 MFI from the blood and peritoneal cells. In the blood there is a trend toward decreased expression and in the peritoneal there is a significant difference between the two time points (*P = 0.004).

