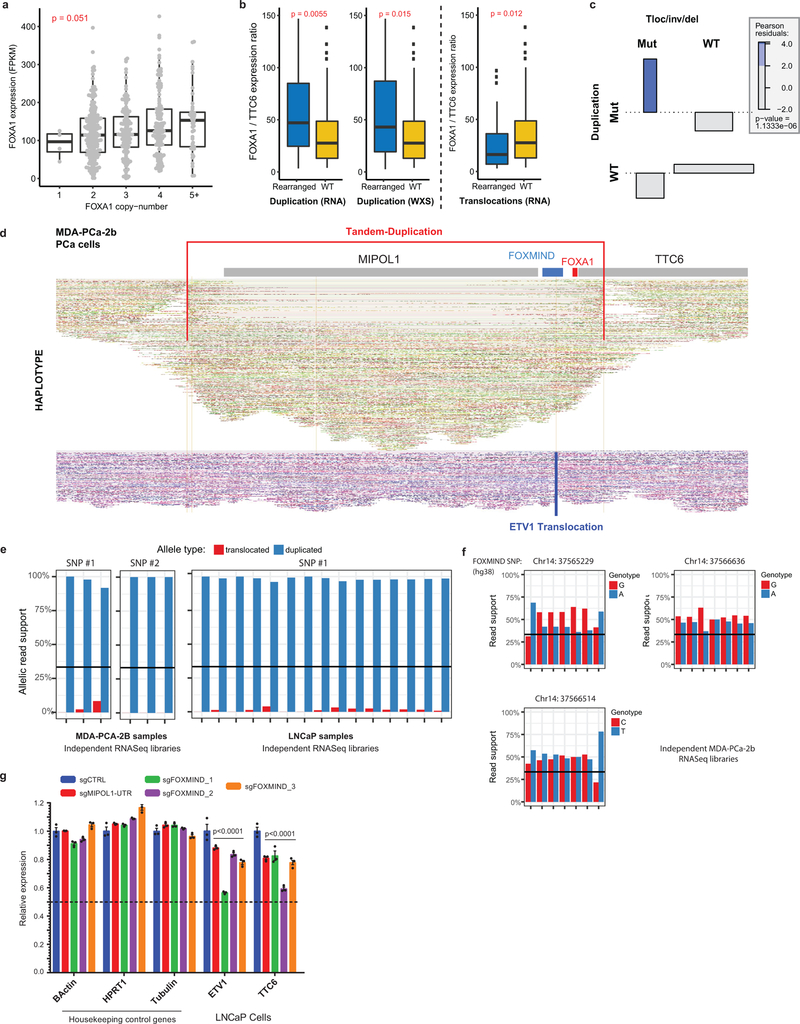
Extended Data Figure 10. Transcriptional and genomic characteristics of Class3 FOXA1 rearrangements in prostate cancer.
a) Dosage sensitivity of the FOXA1 gene. Expression of FOXA1 (RNA-seq) across mCRPC tumors (n=370) as a function of gene ploidy (as determined by absolute copy number at the FOXA1 locus (two-way ANOVA). b) Relative expression of FOXA1 (within the minimally amplified region) to TTC6 (outside the amplified region) in rearranged (n=50) (duplication or translocation) vs WT (n=320) FOXA1 loci (two-sided t-test). All boxplot center shows median, box marks Q1/Q3, whiskers span Q1/Q3±1.5xIQR. c) Association plot visualizing the relative enrichment of cases with both translocation and duplications within the FOXA1 locus (n=370). Over-abundance of cases with both events is quantified using Pearson-residuals. Significance of this association is based on the Chi-square test without continuity correction. Tloc, translocation; inv, inversion; del, deletion. d) FOXA1 locus visualization of linked-read (10X platform) whole genome-sequencing of the MDA-PCA-2B cell line. Alignments on the haplotype-resolved genome are shown in green and purple. Translocation and tandem-duplication calls are indicated in blue and red, respectively. e) Monoallelic expression of FOXA1 cell-lines with FOXMIND-ETV1 translocations in MDA-PCA-2b (n=6 biological replicates) and LNCaP (n=15 biological replicates). Phasing of FOXA1 SNPs to structural variants is based on linked-read sequencing (Methods). f) Biallelic expression of RNA from the FOXMIND locus assessed using three distinct SNPs in MDA-PCa-2b cells that harbor ETV1 translocation into the FOXA1 locus (n=7 biological replicates). g) mRNA (qPCR) expression of ETV1 and TTC6 upon sgRNA-mediated disruption of the FOXMIND or the MIPOL1-UTR enhancer in LNCaP cells, which also harbor ETV1 translocation into the FOXA1 locus (see Extended Data Fig. 9d for sgRNA binding sites). Distinct sgRNA pairs cutting at FOXMIND serve as biological replicates. Mean ± s.e.m are shown (n=3 technical replicates; two-way ANOVA and Tukey’s test).

