Figure 5.

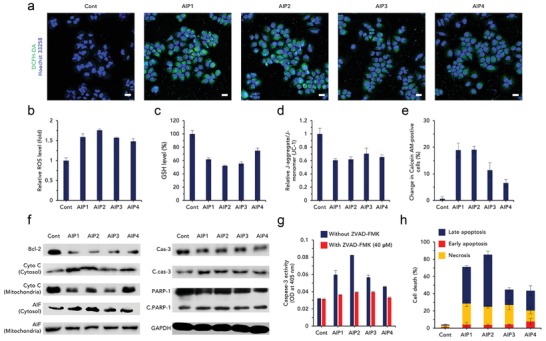
Induction of ER stress‐mediated apoptosis by oxidative stress. a) Visualization of ROS using DCFH‐DA after treatment with AIPs (0.25 × 10⁻⁶ m) (scale bar; 20 µm). Quantification of b) ROS (fold; comparison to untreated group) and c) GSH level (%) to verify the presence of oxidative environments (n = 3, S.D.). Disruption of mitochondria by oxidative stress. d) JC‐1 assay for depolarization of mitochondrial membrane potential (n = 3, S.D.). e) Mitochondria transition pore assay expressed as the change in calcein‐AM‐positive cells (n = 3, S.D.). f) Immunoblotting of apoptosis‐related proteins (Bcl‐2, Cyto C: cytochrome C, C.cas‐3: cleaved caspase‐3, Cas‐3: caspase‐3, C.PARP‐I: cleaved PARP‐I). Glyceraldehyde 3‐phosphate dehydrogenase (GAPDH) was used as a protein loading control. g) Caspase‐3 activity using Ac‐DEVD‐p‐nitroaniline, a caspase‐3 substrate, quantified by optical density (OD) at 405 nm (n = 3, S.D.). h) Cell death evaluated by flow cytometry after FITC‐annexin V and PI staining (n = 4, S.D.). **p < 0.01, ***p < 0.005, ****p < 0.0001 (compared to control) (t‐test).
