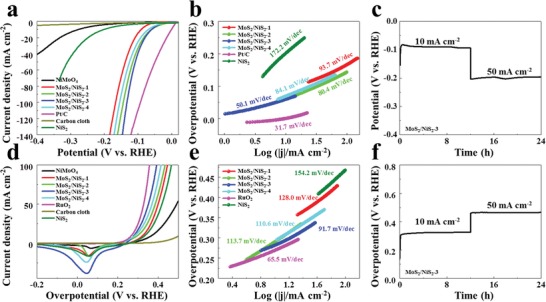
Figure 4.

a) Polarization curves and b) the corresponding Tafel plots of obtained sample for HER. c) Chronopotentiometric curve of HER for MoS2/NiS2‐3 nanosheets. d) Polarization curves and e) the corresponding Tafel plots of obtained sample for OER. f) Chronopotentiometric curve of OER for MoS2/NiS2‐3 nanosheets.
