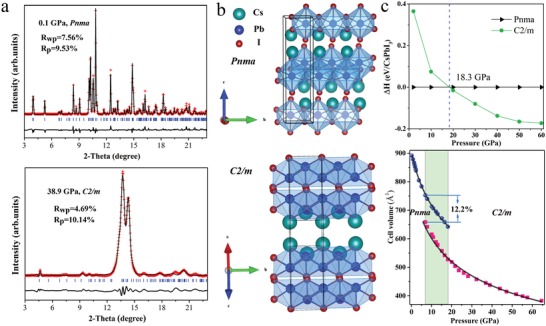
Figure 3.

a) Rietveld refinement of XRD patterns at 0.1 and 38.9 GPa (λ = 0.6199 Å). The solid symbols and lines represent the experimental and calculated data, respectively, and the solid lines at the bottom are the residual intensities. The vertical bars indicate the peak positions. b) Crystal structures of CsPbI3 with symmetry Pnma and C2/m. c) Pressure dependence of the enthalpy difference and cell volume. The solid lines are the Birch–Murnaghan fitting curves to the experimental V(P) data.
