
Figure 6.
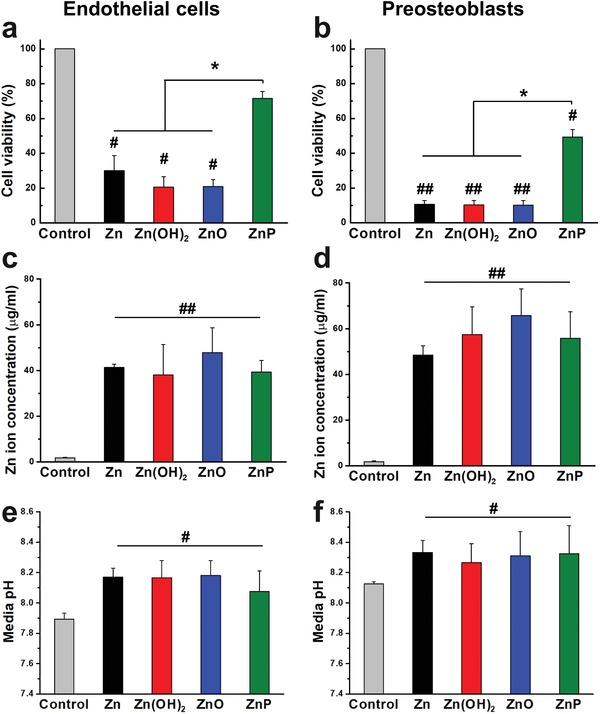
Cell viability by direct MTT assay. a) Endothelial cells and b) preosteoblasts, and the corresponding c,d) Zn ion concentration and e,f) pH change after 3 days of cell culture. #p < 0.05, ##p < 0.005, compared with control group; *p < 0.05, compared between groups.