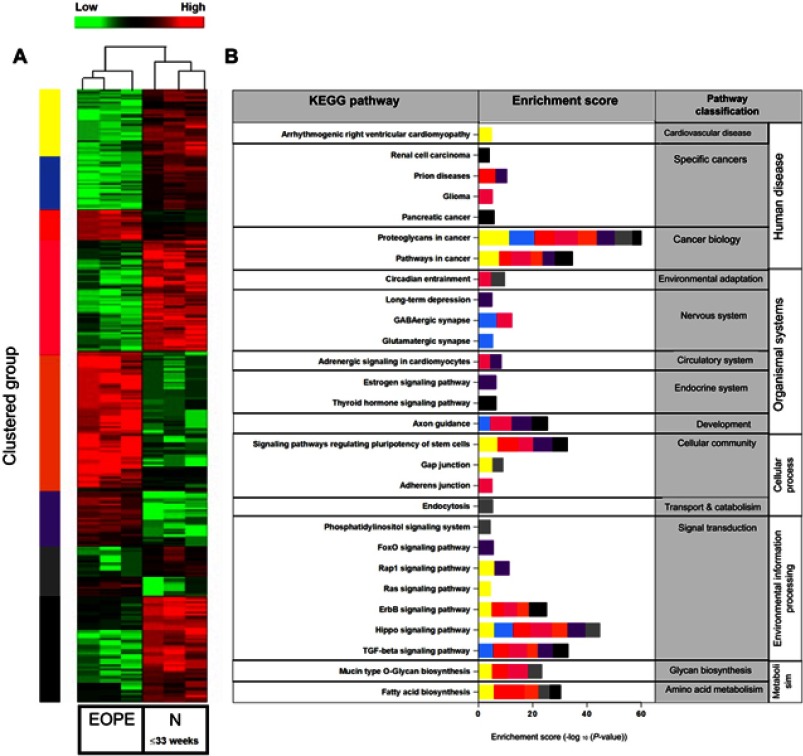
Figure 2.
Comparison of exomiRNA expression profiles of Early onset Preeclamptic (EOPE) vs Normotensive derived exosomes. (A) Heatmap representing hierarchical clustering of differentially expressed miRNAs in EOPE (n=15, pooled into three technical replicates) and normotensive (n=15, pooled into three technical replicates) derived exosomes using average linkage clustering and Spearman Rank as distance metrics. miRNA profiles are clustered in 7 different subgroups (as indicated by the color bar on the right of the heatmap) defined by the miRNA expression patterns. Samples are shown in columns, miRNA in rows. Heat map from green to red represents relative miRNA expression as indicated in the key bar above the dendrogram. (B) KEGG (Kyoto Encyclopedia of Genes and Genomes) pathway mapping for top canonical pathways represented by the differentially expressed miRNA within each cluster, as determined by Descriptive Intermediate Attributed Notation for Ada (DIANA) miRPATH V.3.0 software.

