Figure 3.

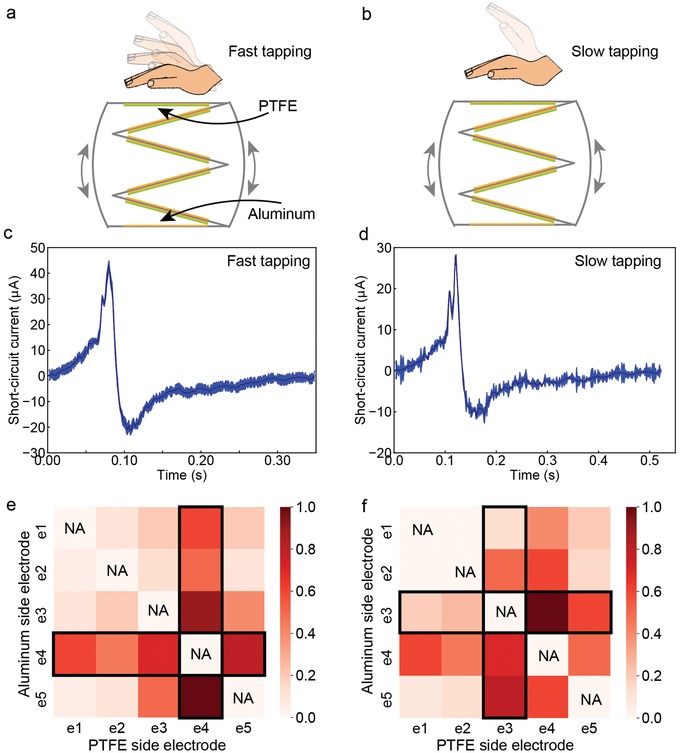
In vivo mapping of stimulation efficiency using different electrode configuration. a) Illustration of fast tapping. b) Illustration of slow tapping. c) Short‐circuit current waveform during fast tapping. d) Short‐circuit current waveform during slow tapping. e) Heatmap of stimulation efficiency under fast tapping. f) Heatmap of stimulation efficiency under slow tapping.
