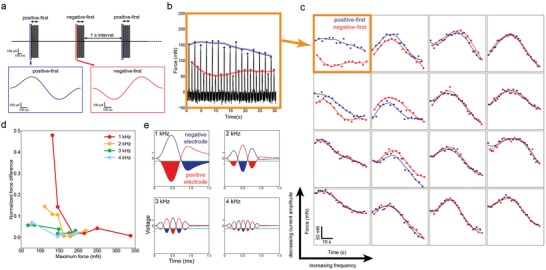
Figure 7.

In vivo measurement of how stability is affected by stimulation waveform frequency and current amplitude. a) Positive‐first and negative‐first stimulation was alternatively delivered. b) A measured force profile. Force measured with positive‐first stimulation is marked in blue and force measured with negative‐first stimulation is marked in red. c) With lower frequency and lower amplitude, stimulation avoids synchronization of the motoneuron recruitment at the two stimulation electrodes (marked in orange).
