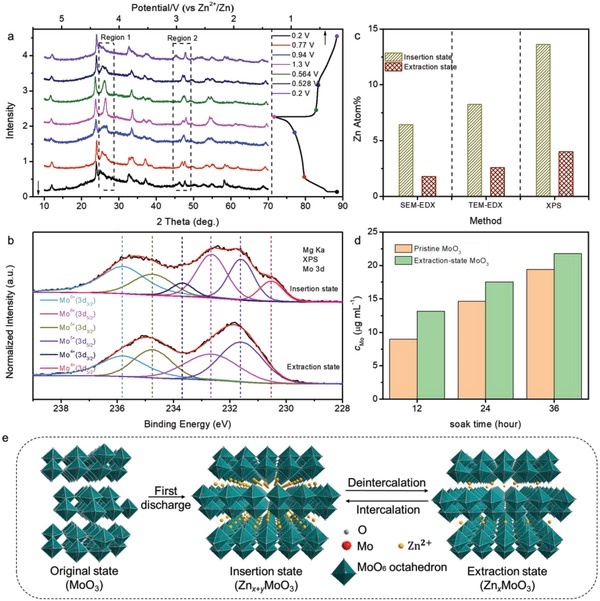
Figure 3.

a) XRD pattern of MoO3 at different voltage. b) Core‐level Mo 3d XPS spectra and c) Zn Atom% obtained by different methods of MoO3 nanowires in insertion (0.2 V) and extraction (1.3 V) state. d) C Mo for aqueous electrolyte after pristine MoO3 and extraction‐state MoO3 were immersed for different time. e) Schematic illustration of the Zn2+ intercalation/deintercalation mechanism for orthorhombic MoO3 electrode.
