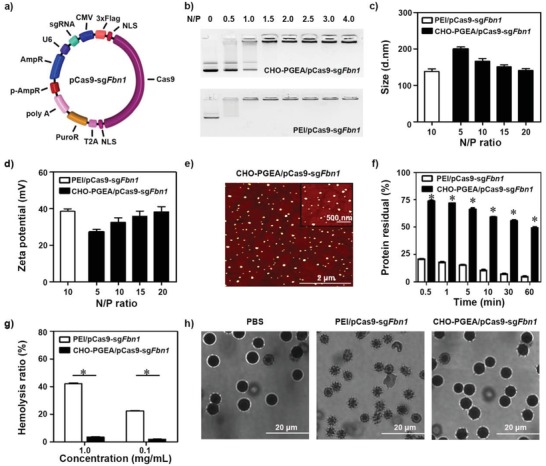
Figure 2.

a) Schematic diagram of pCas9‐sgFbn1 plasmid. b) Agarose gel electrophoresis. c) Particle sizes and d) zeta potentials of polycation/pCas9‐sgFbn1 complexes at various N/P ratios. e) Morphologies of CHO‐PGEA/pCas9‐sgFbn1 nanoparticles at N/P = 15 measured by atomic force microscope. f) Protein assay of polycation/pCas9‐sgFbn1 complexes (at their respective N/P ratio) treated with excess BSA. g) Hemolysis ratio of red blood cells (RBCs) treated with different polycaiton/pCas9‐sgFbn1 complexes at the concentration of 0.1 and 1 mg mL−1, where deionized water and PBS were used as positive and negative controls. h) Morphologies of RBCs treated with PBS, PEI/pCas9‐sgFbn1, and CHO‐PGEA/pCas9‐sgFbn1 (*P < 0.05; data are from three independent experiments).
