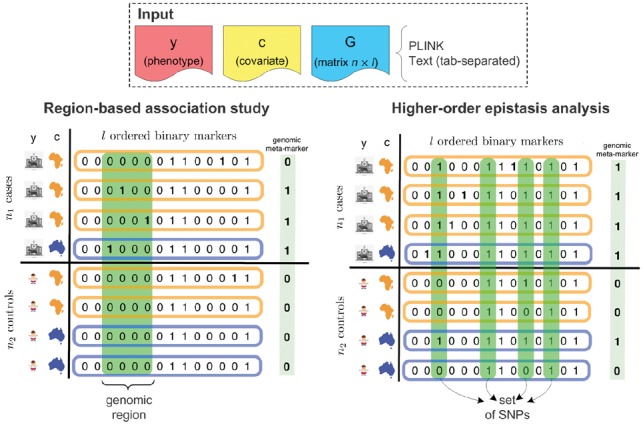
Fig. 1.

Overview of the two types of combinatorial association mappings supported by CASMAP. The input phenotype y and sample data matrix G are binary. The covariate c is discrete and here represents the genetic ancestry of the individual (correction for population structure). Input is in PLINK format or tab-separated text files. The meta-marker for each individual is created differently depending on the type of analysis: for regions is a Boolean OR and for sets is the Boolean AND (see Supplementary Section S3)
