
Figure 1.
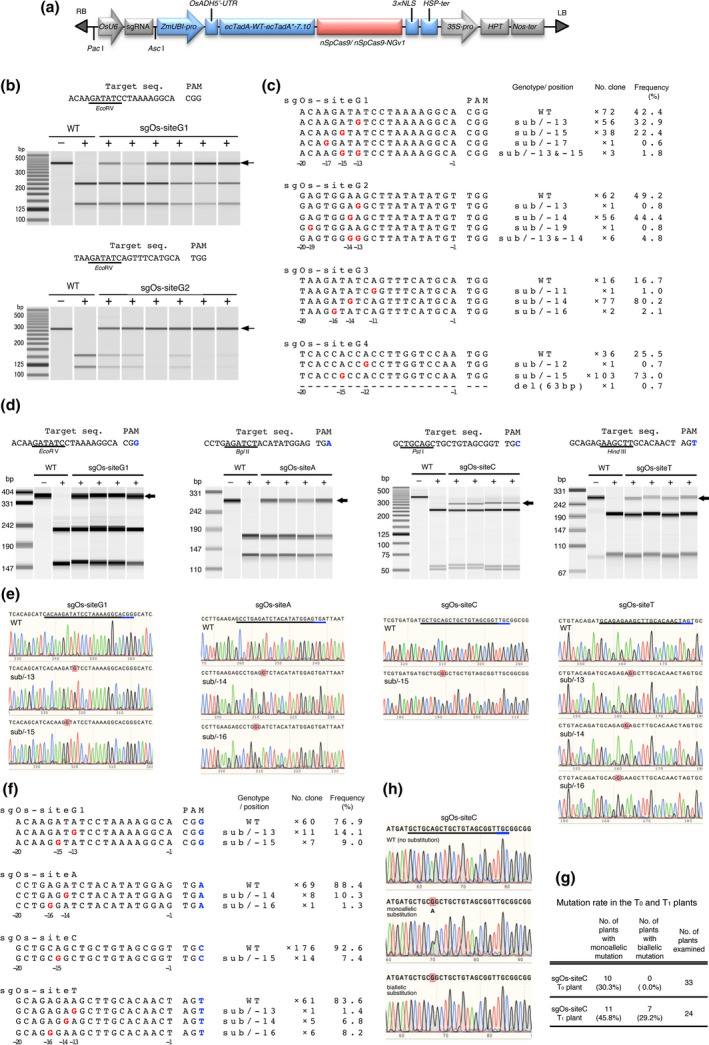
ABE7.10‐nSpCas9‐NGv1 can induce A‐to‐G substitution at target sequences with 5′‐NG‐3′ as PAM. (a) Expression construct for sgRNA and ABE7.10‐nSpCas9 or ABE7.10‐nSpCas9‐NGv1 (R1335A/L1111R/D1135V/G1218R/E1219F/A1322R/T1337R) in rice. nSpCas9; SpCas9 nickase (D10A). (b) CAPS analysis at target locus with NGG as PAM in ABE7.10‐nSpCas9 transformed rice calli. Arrows indicate undigested fragments. −/+ without/with restriction enzyme. (c) Mutations detected in ABE7.10‐nSpCas9 transformed rice calli. The wild‐type sequence is shown at the top. Substituted bases and deletions are shown in red letters and dashes, respectively. Sequence genotype, position of the mutated base, number of sequenced clones and mutation frequency (%) are noted to the right of each sequence (sub; substitution, −; deletion, ×; number of sequenced clones). Numbers below the sequence indicate the number of bases from the PAM (first letter of PAM is +1). (d) CAPS analysis at target locus with NGG, NGA, NGC and NGT as PAM in ABE7.10‐nSpCas9‐NGv1 transformed rice calli. (e) Sanger sequencing chromatograms of wild type and mutants induced by ABE7.10‐nSpCas9‐NGv1. The black and blue underlining indicates the target sequence and PAM, respectively. Substituted bases are indicated by red squares. (f) Mutations induced in the target sequences. (g) Mutation rate in T0 and T1 plants. (h) Representative Sanger sequencing chromatogram of T1 plants.