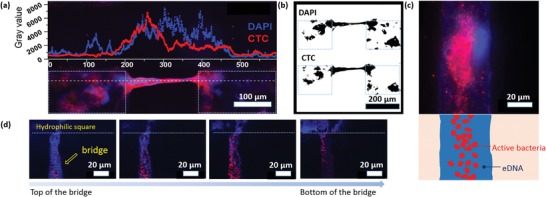
Figure 4.

Fluorescence microscope images of bridges of P. aeruginosa PA 49 after 24 h biofilm formation stained with CTC (metabolically active cells, red) and DAPI (DNA as total biomass indicator, blue). a) Fluorescence intensity of CTC and DAPI staining of the line (white dot line) along a biofilm bridge connecting two biofilm clusters. b) Images of the biofilm bridge after threshold adjustment. c) Fluorescence microscope image of a biofilm bridge at a higher magnification showing active bacteria and extracellular structural DNA (top). Corresponding schematic (bottom). d) Z‐stack images of a biofilm bridge. Images from left to right represent features of bridges at different Z‐positions from the top to the bottom of the bridge.
