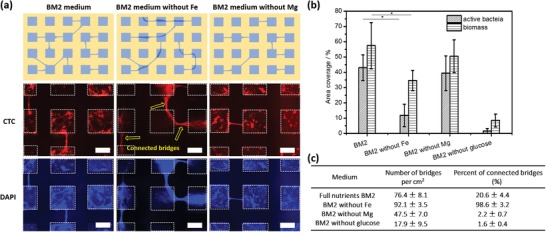
Figure 7.

The effect of nutrients on biofilm bridges. PA49 was cultured for 1 day in original BM2 medium, BM2 medium without Fe, BM2 medium without Mg, and BM2 medium without glucose. a) Schematic illustration of different types of networks of biofilm bridges depending on the presence or absence of Fe and Mg in the medium. (Below) Fluorescence images of biofilm bridges stained with CTC and DAPI. Square hydrophilic spots are indicated by white dashed lines. The scale bar is 200 µm. b) Area coverage (in %) of metabolically active bacteria (stained with CTC) and eDNA (stained with DAPI) after 1 day incubation under different conditions. The graph shows the importance of Fe and glucose present in the medium for the amount of active bacteria on the surface. c) Number of biofilm bridges per cm2 and the percentage of bridges where at least one end of the bridge is connected with another bridge through the biofilm cluster formed in the hydrophilic square (number of “connected bridges”).
