
Figure 7.
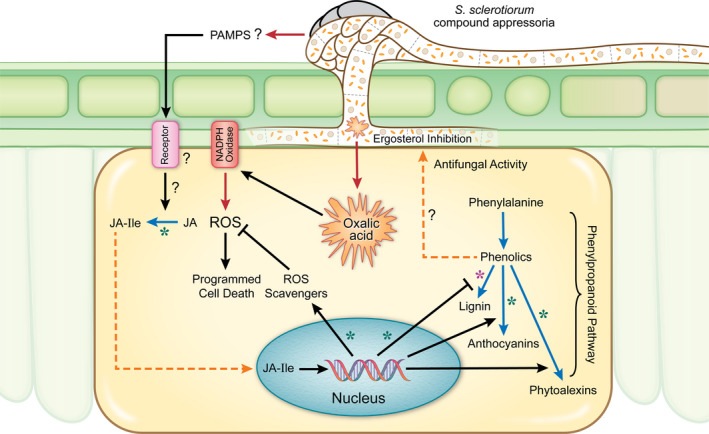
Cellular model summarizing S. sclerotiorum resistance mechanisms in soybean. Black line = induction/suppression of a process, red line = secretion/release, blue line = bioconversion, dashed orange line = translocation of a metabolite, purple asterisk (*) = down‐regulation in resistant response, green asterisk (*) = up‐regulation in resistant response, JA = jasmonic acid, JA‐Ile = jasmonic acid‐isoleucine.