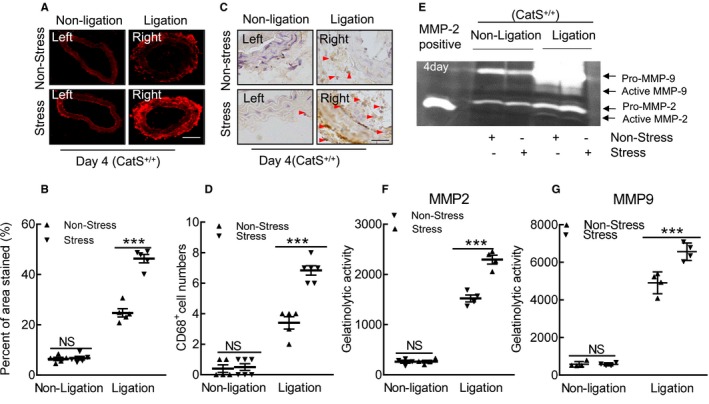
Figure 6.

Stress accelerated the oxidative stress production and macrophage infiltration in response to injury at day 4. A and B, Representative images of dihydroethidium staining and quantitative data for positive staining area of the injured arterial tissues. C and D, Representative images and quantitative data for CD68+ cell numbers (arrowheads). E through G, Representative images of gelatin zymography and combined quantitative data for gelatinolytic activities of matrix metalloproteinase (MMP)‐2 and MMP‐9 in the nonstressed and stressed groups. Bar=100 μm. Results are mean±SEM (n=4–6). CatS+/+ indicates cathepsin S wild type; NS, no significance. ***P<0.001 vs nonstressed group by 1‐way ANOVA, followed by Tukey post hoc tests.
