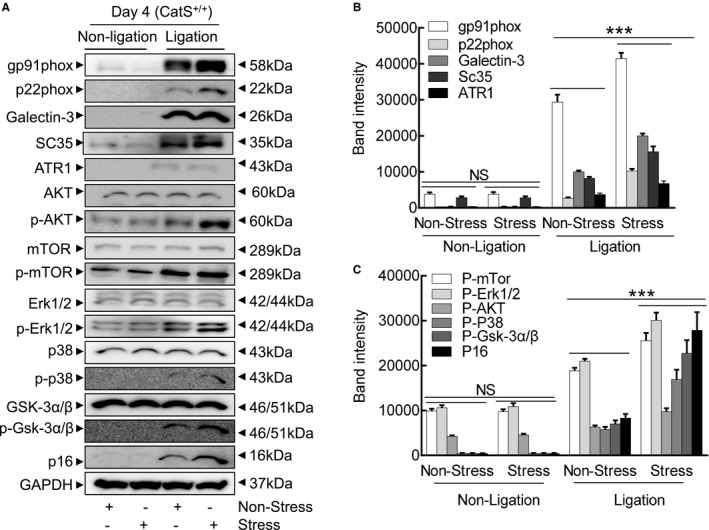
Figure 7.

Stress altered the levels of targeted protein in the injured arteries. A through C, Representative images and combined quantitative data for the levels of targeted proteins. Results are mean±SEM (n=5–7). AKT indicates protein kinase B; ATR1, angiotensin II receptor 1; CatS+/+, cathepsin S wild type; Erk, extracellular signal‐regulated kinase; GSK, phosphoglycogene synthesis kinase; mTOR, mammalian target of rapamycin; NS, no significance; p‐AKT, phosphorylated AKT; p‐Erk, phosphorylated Erk; p‐mTOR, phosphorylated mTOR. ***P<0.001 vs the relative controls by 1‐way ANOVA, followed by Tukey post hoc tests.
