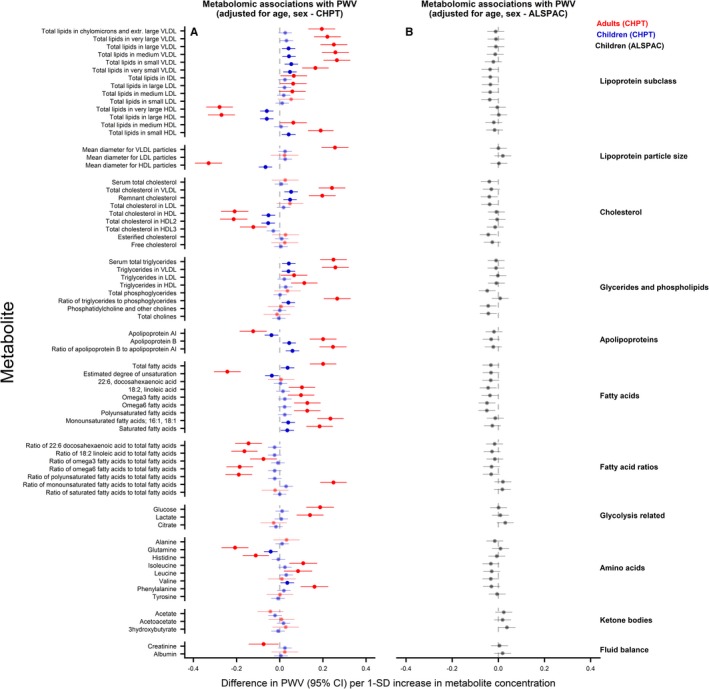
Figure 5.

Associations between metabolomic measures and pulse wave velocity (PWV) in children and adults. Association measures are difference in PWV per 1‐SD unit increase in metabolite concentration for A) CheckPoint children (blue), CheckPoint adults (red), and B) The Avon Longitudinal Study of Parents and Children (ALSPAC) children (gray) adjusted for age and sex. Error bars represent 95% confidence intervals (CI). Significant associations after P values adjusted for multiple testing using the Benjamini–Hochberg procedure are shown in bold (false discovery rate=0.10). CHPT indicates Child Health CheckPoint; HDL, high‐density lipoprotein; IDL, intermediate‐density lipoprotein; LDL, low‐density lipoprotein; VLDL, very‐low‐density lipoprotein.
